This month saw a milestone with the news that more than a million electric vehicles have now been sold in the UK, over the past two decades.
Yet despite this, a recent report published by the House of Lords Environment and Climate Change Committee has highlighted the need for the government to do far more to support the transition to EVs to ensure the UK meets its net zero targets in time.
There have been a lot of conflicting news stories about whether electric vehicles (EVs) are better or worse for society and the environment compared to internal combustion engine (ICE) cars. Some point to the carbon emissions caused by the manufacturing of the batteries needed for EVs, which are typically higher than emissions released during the production of ICE vehicles.
However, while there are some negative impacts associated with EVs, it is important to compare this to the incumbent technology, which is the ICE. Our conclusion on this is that EV vehicles are much better for the planet and society than ICE cars and this improvement is likely to get much bigger in the future – so we should pursue and back this technology. We take a closer look at the research below, which we believe backs this up.
Are EVs better or worse for the environment than ICE?
The International Energy Agency[1] (IEA) published its Comparative life-cycle greenhouse gas emissions of mid-sized BEV and ICE vehicle (figure below)[2]. Comparative life-cycle greenhouse gas emissions of a mid-size BEV and ICE vehicle – Charts – Data & Statistics - IEA
Comparative life-cycle greenhouse gas emissions of a mid-size BEV and ICE vehicle
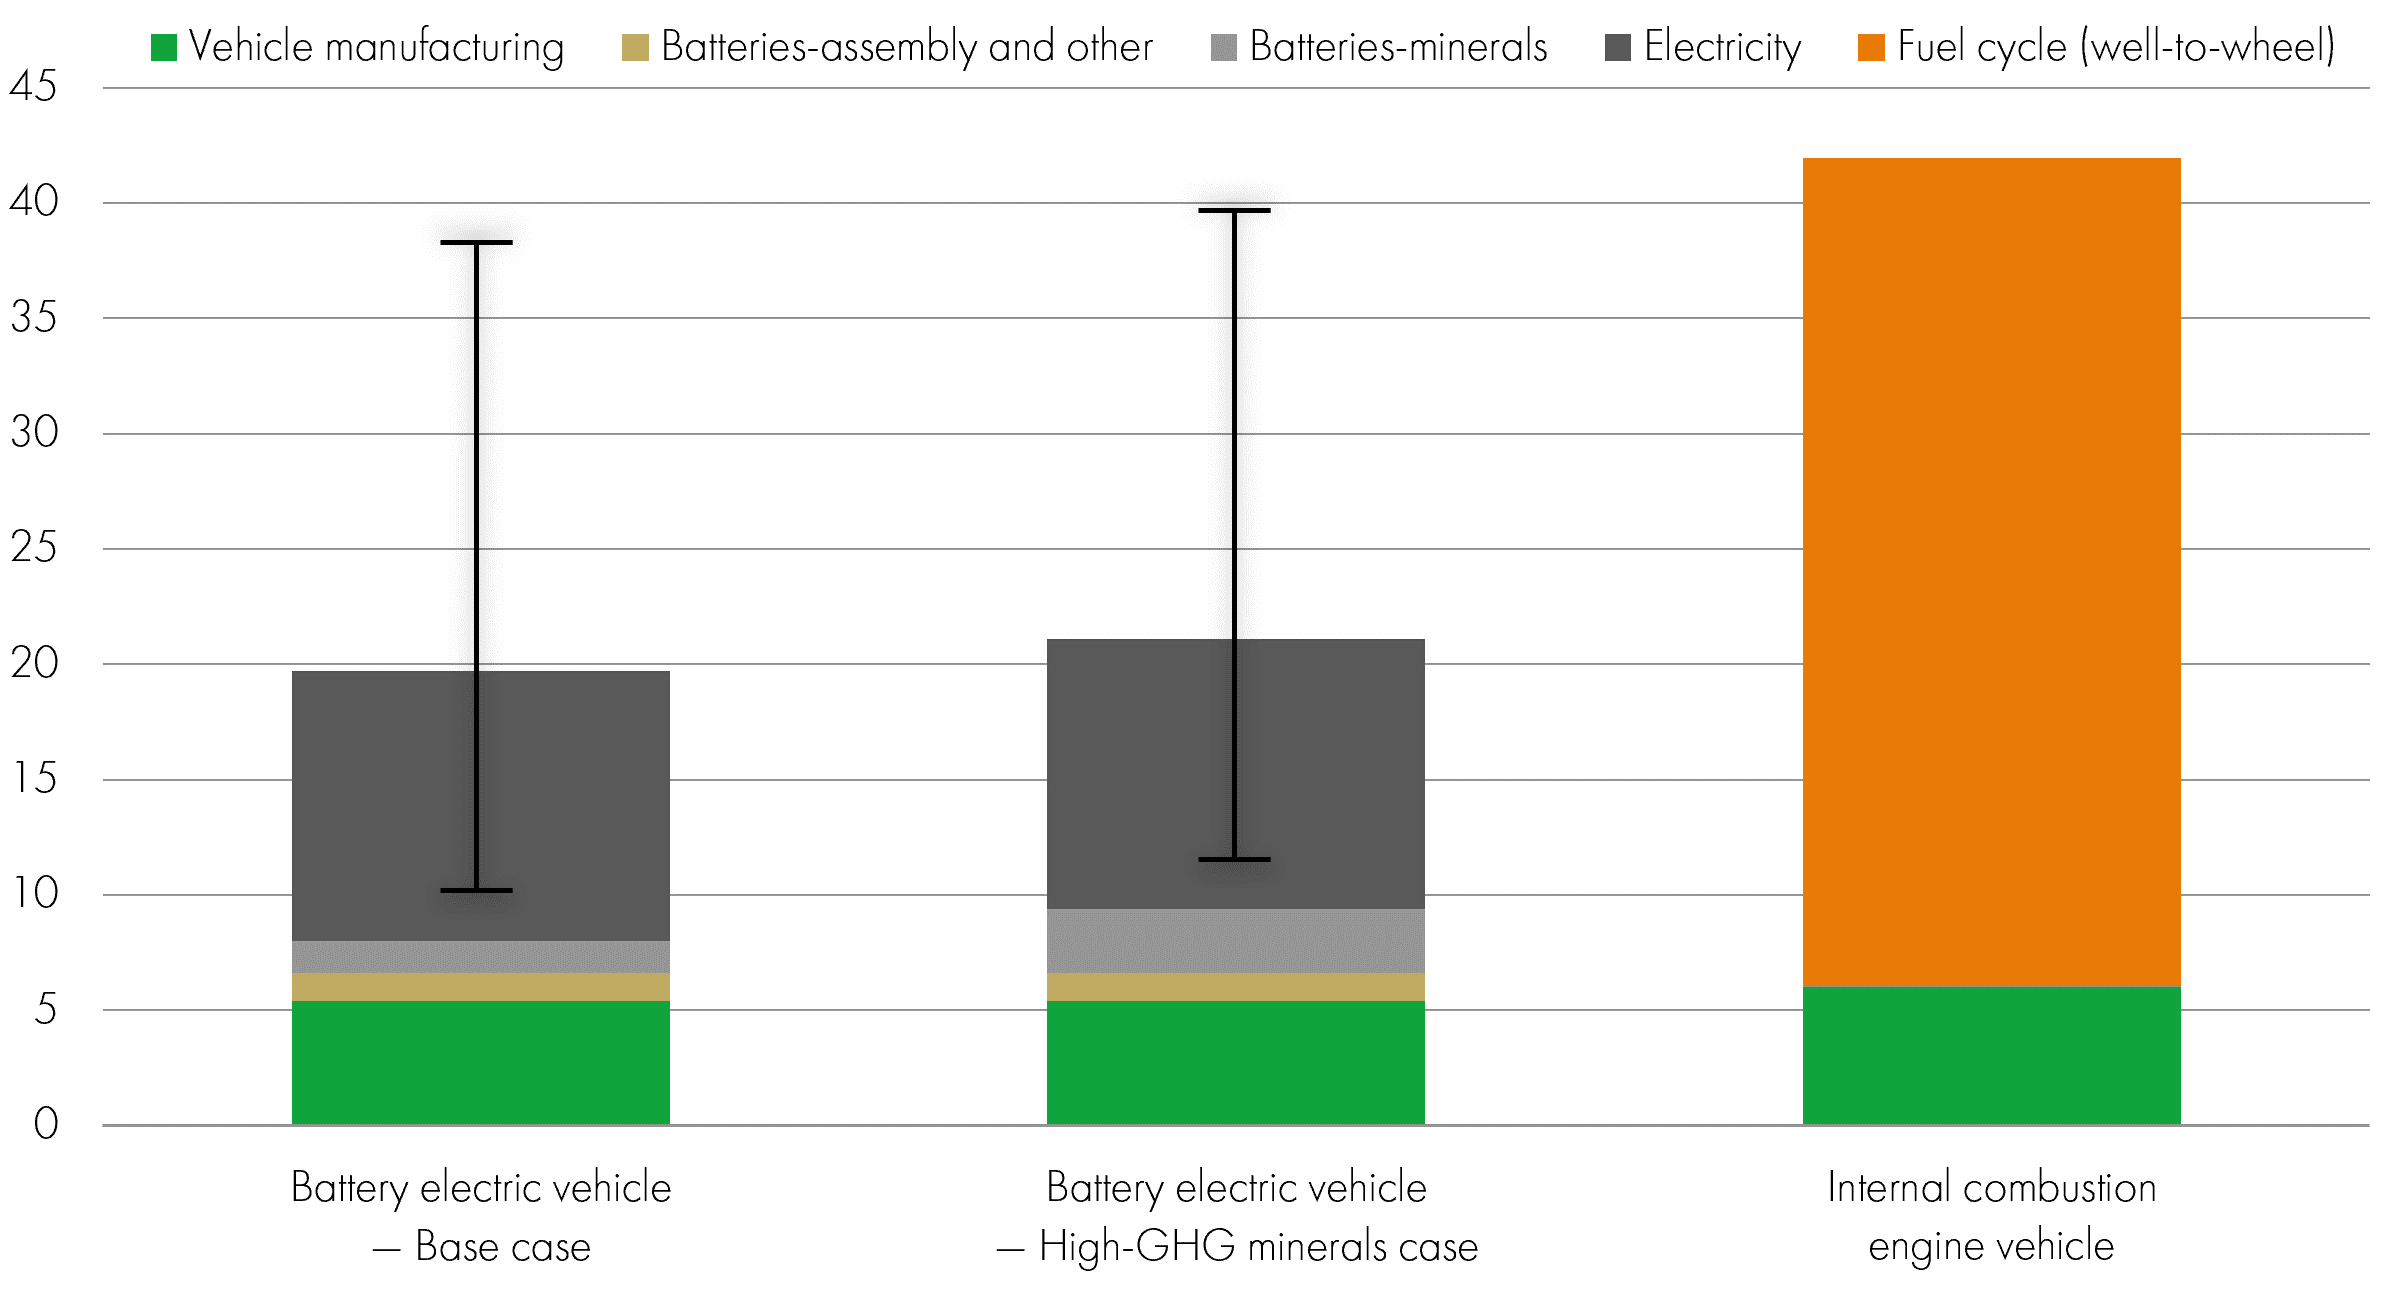
Source: IEA analysis based on IEA (2020c); Kelly et al. (2020); Argonne National Laboratory (2020).
Greenhouse gas (GHG) emissions from the lifecycle of a car are broken down into two distinct areas:
1) The embedded emissions in making the vehicle, which include mining and processing the minerals and metals used.
2) The emissions in use i.e. how much the car emits when it is driven over its lifetime.
Here are some observations:
- For ICE cars, the lifetime emissions which come when they are made (called embedded emissions) are typically around 15% of total emissions (the remaining 85% being emitted by burning fossil fuels when driving an ICE car). For an EV, the proportion of embedded emissions over its lifetime is significantly higher at around 40-45% of total emissions, the remainder (55%-60%) comes from the carbon emitted in generating the electricity used to charge the car (measured in grid intensity by country, gCO2e/kWh).
- The critical number is the difference in total emissions between the ICE vehicle and the EV: taking into account the emissions both from making and using the cars. Through its lifecyle, an EV emits around 50% less than a typical ICE; meaning the EV saves approximately half of the emissions that would come from using an ICE.
- However, in reality the total emissions from an EV can vary significantly, as these are dependent on the carbon intensity of the electricity used to charge it. The estimates in the IEA study use the global average carbon intensity of grid electricity, which in 2022 was around 466 gCO2e/kWh[3]. Let’s adjust these total lifecycle emissions depending on what country (and therefore how carbon intensive the electricity is on your grid). If you are in the UK, where the carbon intensity of the grid is relatively low (257 gCO2e/kWh – which is good) then the reduction in CO2e emissions from an EV is around 54%, similar to the EU 28 average, but not as good as Norway with a 75% reduction in emissions (due to a high proportion of hydro making the country’s carbon intensity 29g CO2e/kWh which is very low). The emissions savings from having an EV as opposed to an ICE are lower (but still good) where the carbon intensity is higher in places such as the US (367 gCO2e/kWh) at 44%; Japan (397 gCO2e/kWh) at 34%; Australia (503 gCO2e/kWh) at 32% and China (531 gCO2e/kWh) at 29%.
Looking at grid intensities by country, there is nowhere I can find that has grid carbon intensity at 800 gCO2e/kWh as used in the IEA study’s worst-case scenario (yielding only a 17% improvement from an EV versus ICE in terms of the life cycle of GHG emissions).
It is worth noting that the research assumes that the only emissions from diesel or petrol come from them being burnt in use (driving) and that no emissions came from producing the fuel, known as “well to tank” emissions. It is estimated that when you include these emissions, it increases emissions for the ICE cars by 30% for petrol and 24% for diesel[4]. Having adjusted for this, using the IEA analysis, an EV through its lifecycle emits around 80% less as compared to the petrol ICE and around 74% less than a diesel ICE.
We believe there is scope for these emissions (tCO2e over the lifecycle) from EVs to fall significantly over time. ICE cars will get better too, so we throw this together for an estimate of the potential improvements in EVs to make them produce far fewer emissions over their life cycle. By 2030/35 we expect the emissions from EV vehicles to drop by around another 24% in absolute terms due to[5] lower grid carbon intensities; more recycled material being used in batteries, and improvements in the efficiency of EVs. We expect ICE carbon emissions to drop to by around 10% mainly due to fuel efficiency improvements. So the benefits of EVs as compared to ICE in terms of reducing GHG emissions (through the life cycle) will improve further.
Given how carbon intensity of grids is critical in these calculations, we have pulled out some country and region examples.
Carbon intensity of Grids gCO2e/kWh 2022
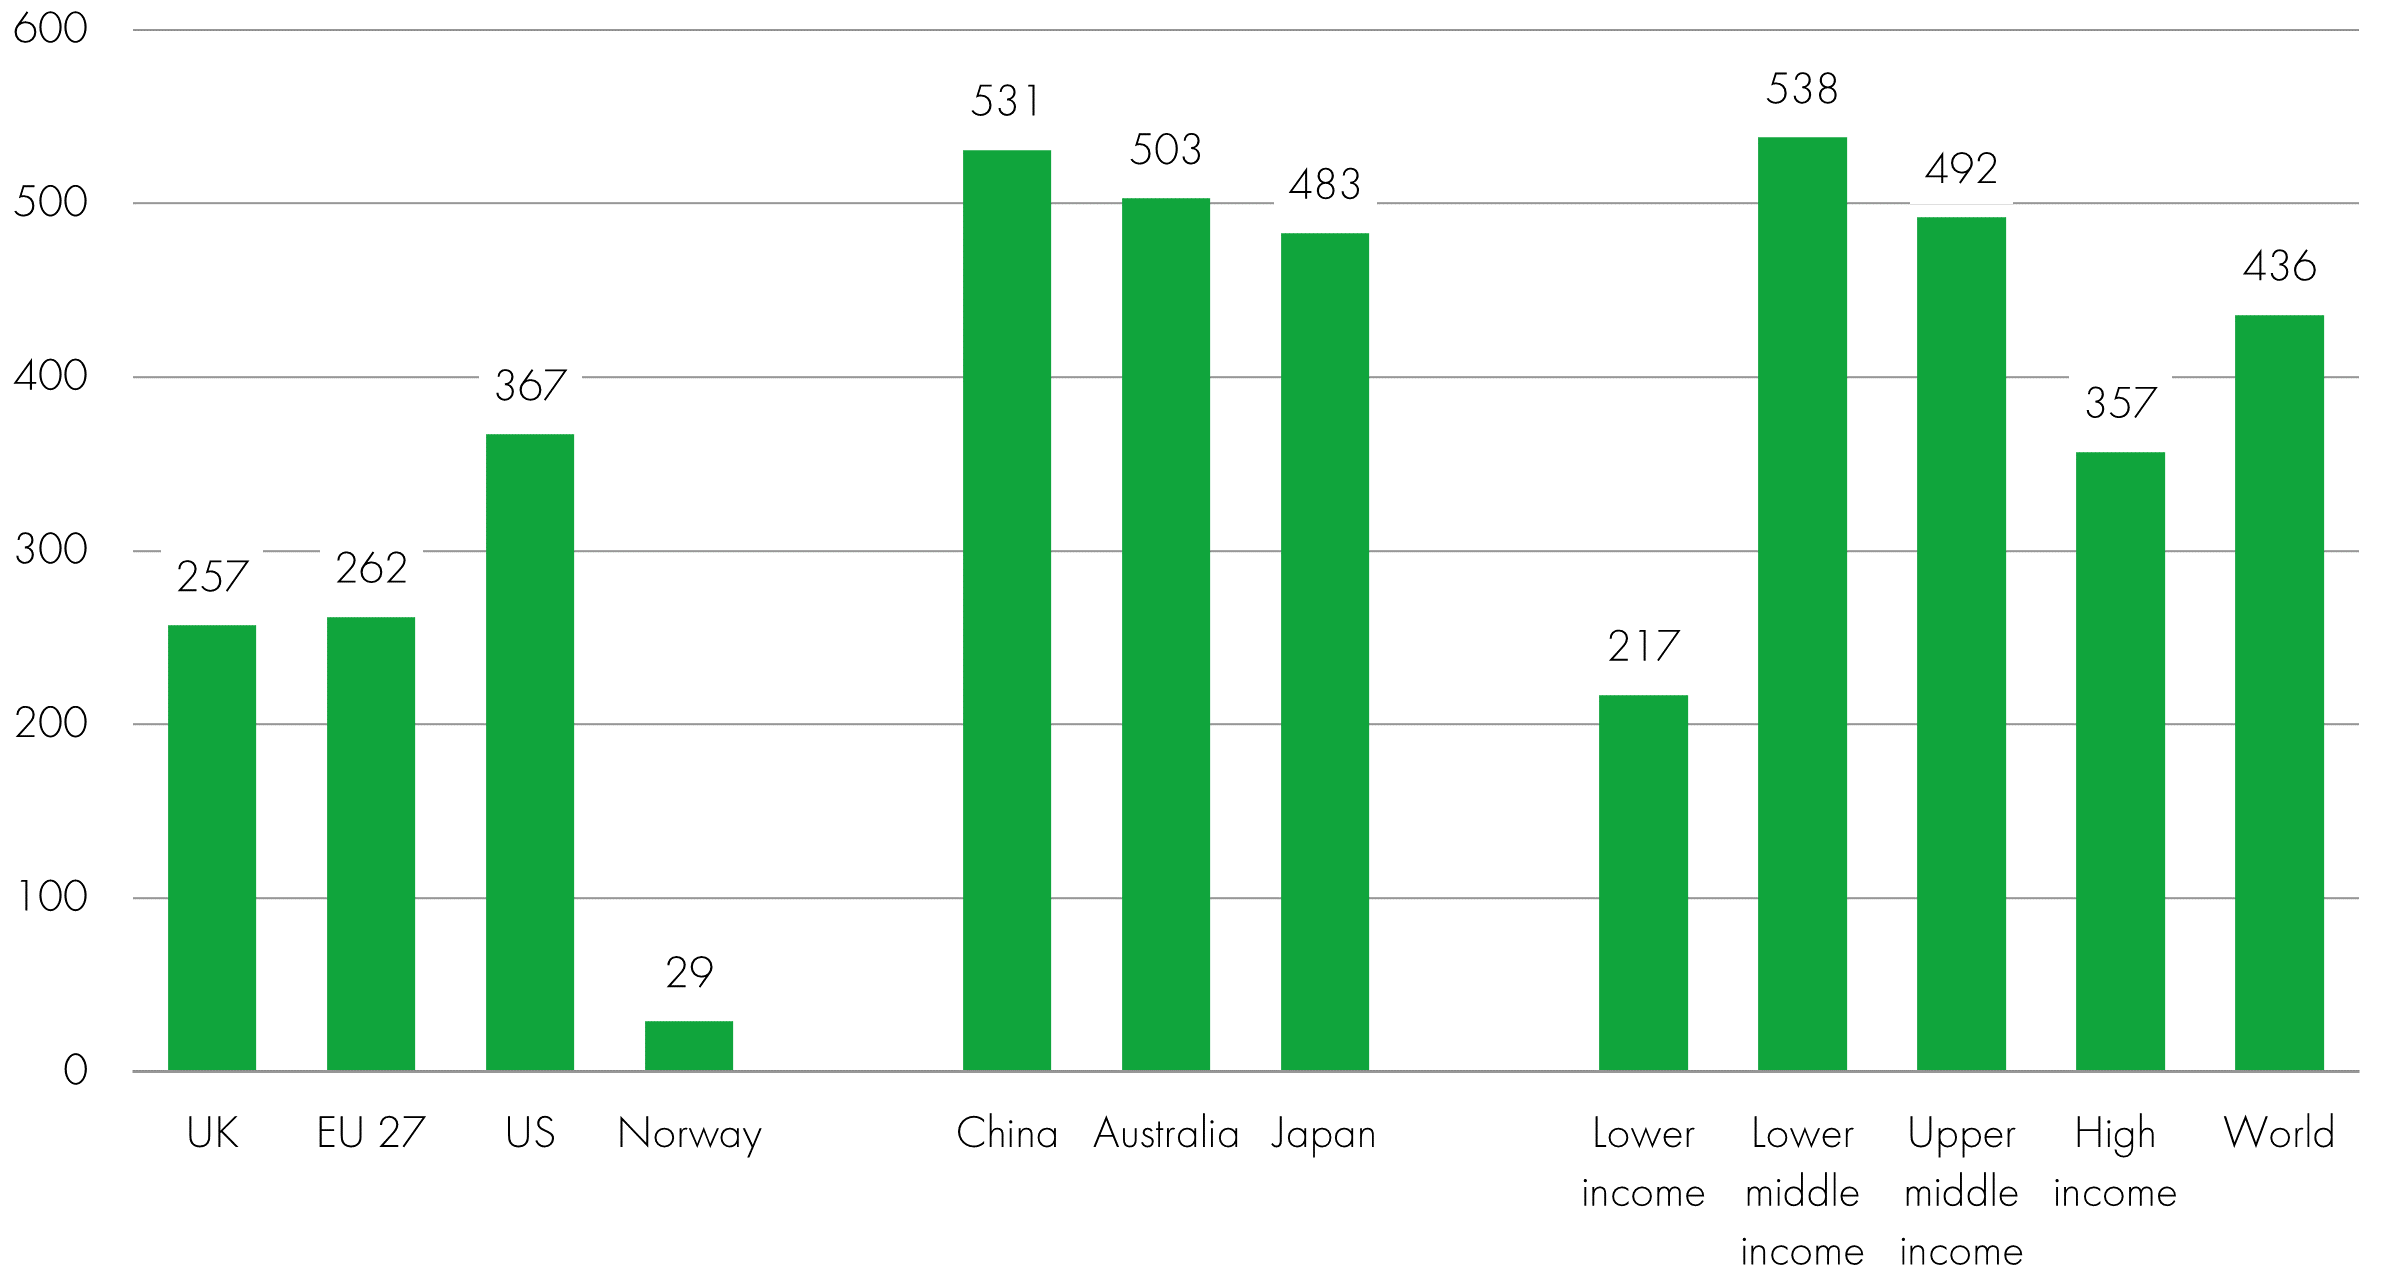
Source: [Ember – Yearly Electricity Data (2023); Ember – European Electricity Review (2022); Energy Institute – Statistical Review of World Energy (2023) – with major processing by Our World in Data]
Now prepare yourself for the good news, the decrease in grid carbon intensity over the past two decades…
% change in grid carbon intensity 2000-2022 (gCO2e/kWh)
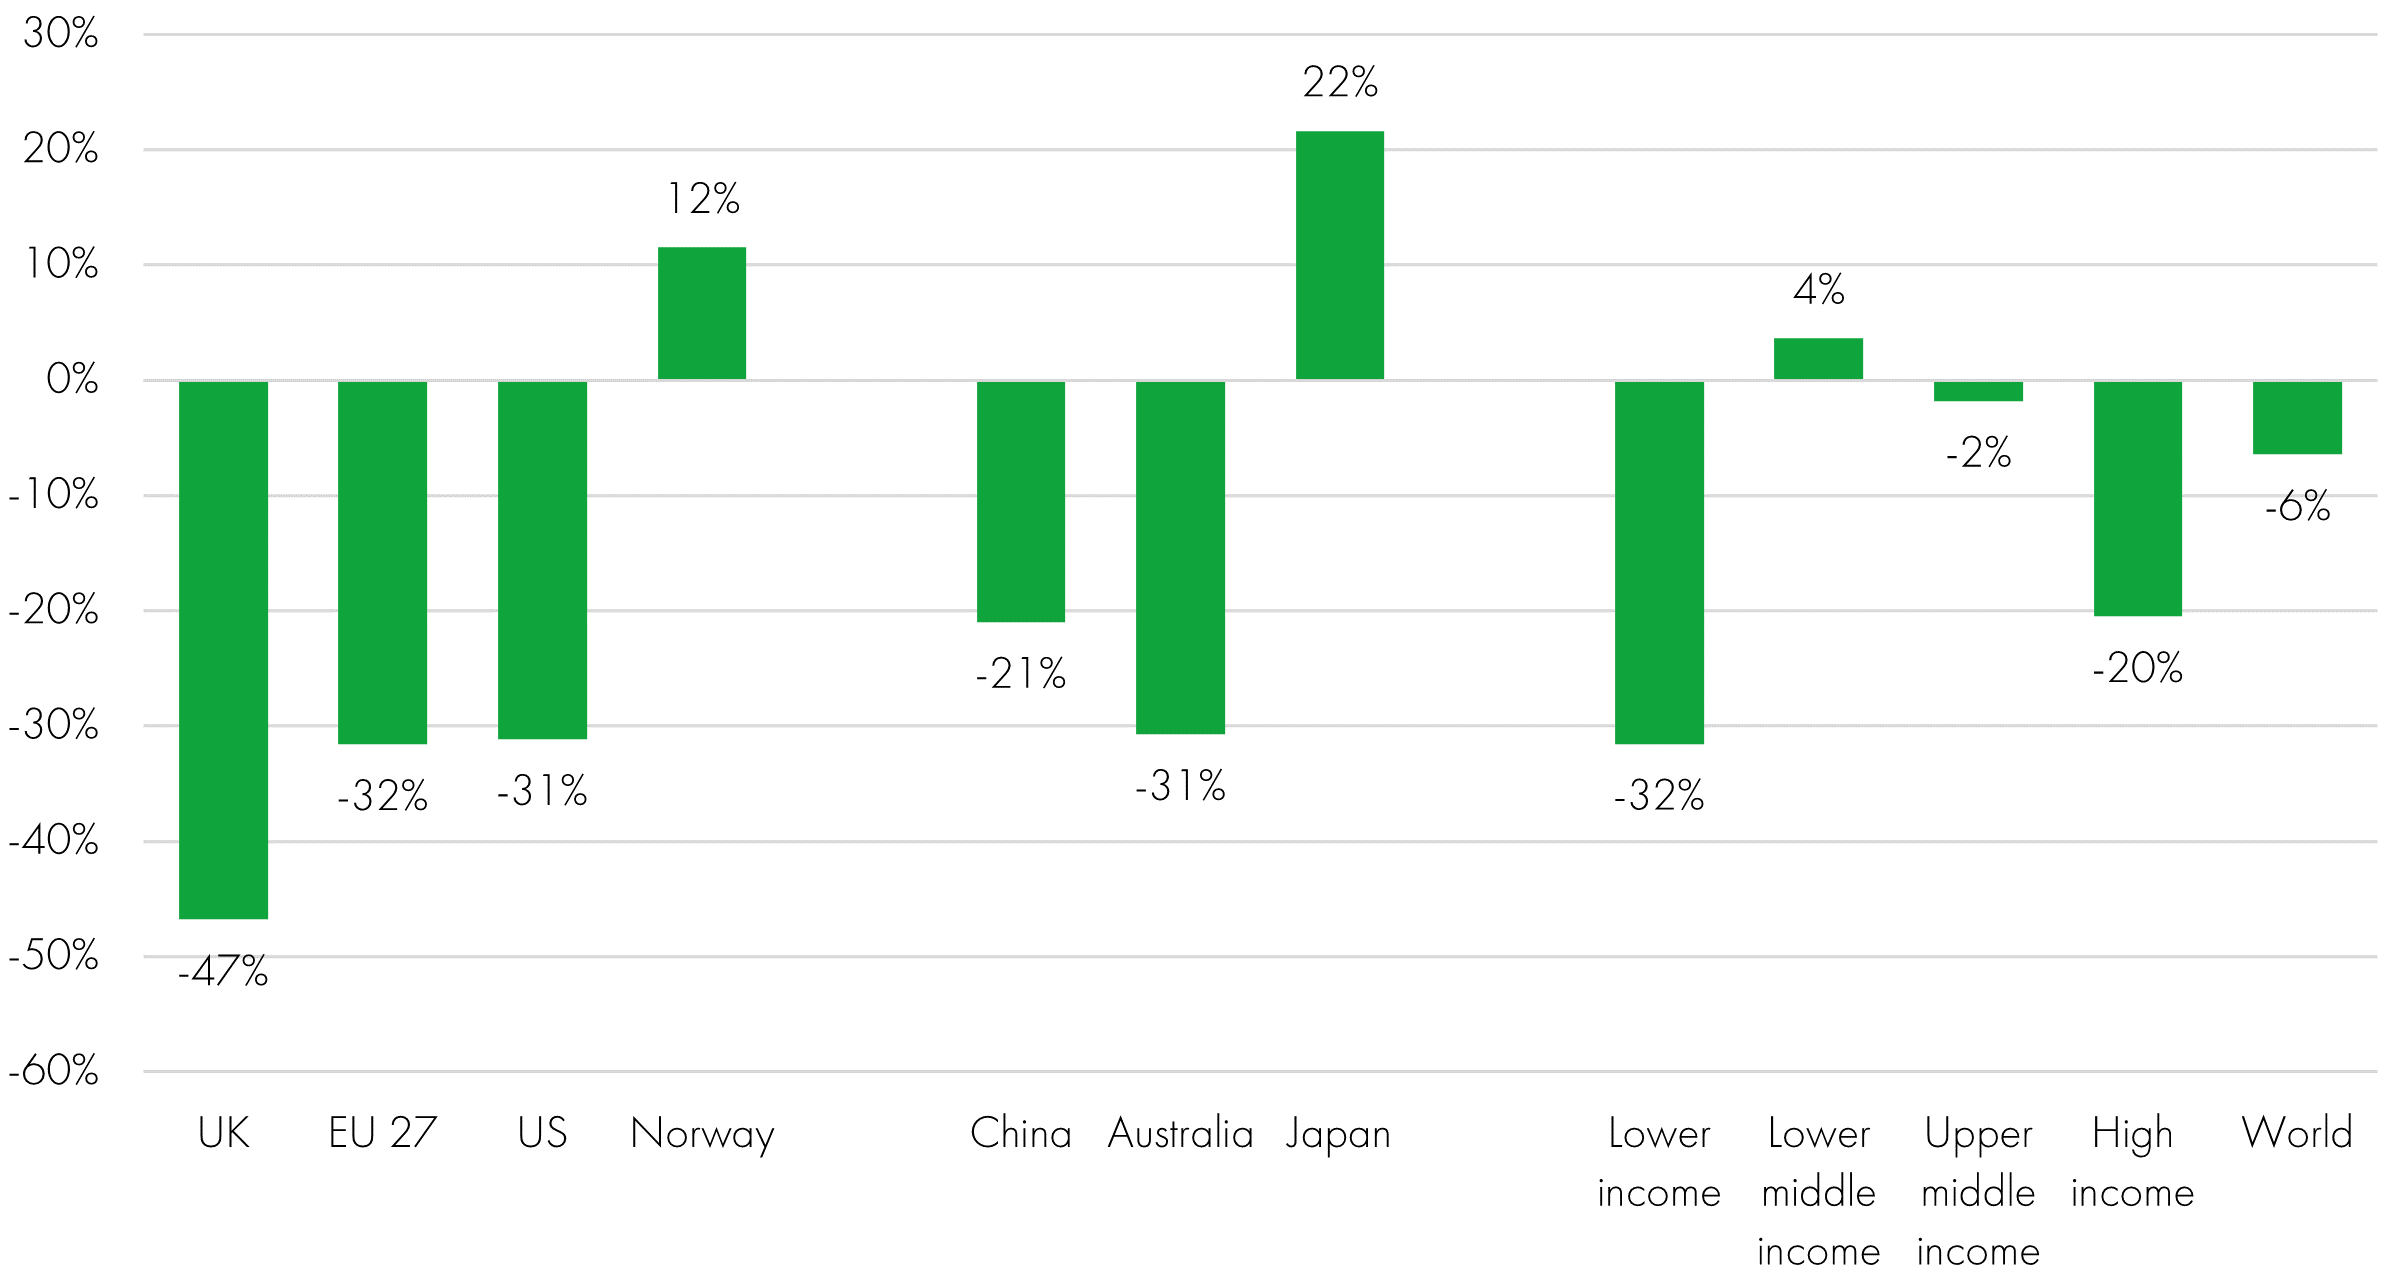
Source: [Ember – Yearly Electricity Data (2023); Ember – European Electricity Review (2022); Energy Institute – Statistical Review of World Energy (2023) – with major processing by Our World in Data].
Emissions don’t tell the whole story: pollution and human rights concerns
While the benefits in terms of reducing GHG emissions by displacing ICE cars with EVs is clear to us, there are real negative impacts, especially in terms of the materials going into the energy transition. These include the impact of mining and processing on the environment as well as human rights and safety in these supply chains. As we look down these supply chains, we look for companies innovating to reduce these negative impacts and those that operate to high health and safety standards. Key materials that come up are: cobalt (much sourced from the Democratic Republic of Congo with concerns around labour rights and artesian mining), lithium (concerns around the sheer volume needed and processes – particularly water consumption), nickel (safety concerns and high sulphurous oxide emissions) and rare earth metals (the vast majority come from China and some have very poor environmental protections in what is a notoriously dirty process to extract). Yet rare earth metals have many end uses, and EVs only account for 12% of total demand (Tesla has announced that it won’t use rare earth metals in its next generation cars)[6].
www.woodmac.com/news/editorial/rare-earth-elements-frequently-asked-questions/ (on rare earths)
There are opportunities to increase recycling, improve processing, and efficiency gains, which all act to reduce the negative impacts of the battery. In addition, where companies we are invested in are relying on these energy transition supply chains for materials, we can challenge them to adopt the highest operational standards (both social and environmental) to gain a competitive advantage while also reducing these negative impacts. The SF funds are not currently invested in battery material miners or manufacturers.
Air quality – big differences between EV and ICE
www.epha.org/electric-vehicles-and-air-pollution-the-claims-and-the-facts/
Estimates vary, but the IEA in 2019 cited research that [7]75-83% of road traffic air pollution was due to emissions from diesel vehicles with NOx (nitrogen oxide) emissions representing the largest share of costs of these pollutants (65%) followed by emissions from fine particulate matter – known as PM2.5 (32%). The total cost (market and non-market costs) of road traffic pollution was estimated as EUR67-80 billion in the EU-27 in 2016.
Reducing air pollutants from road traffic by cutting CO2e emissions (climate change) as well as NOx and PM emissions are all linked. There are two main types of pollution coming from traffic: tailpipe emissions and indirect emissions (brakes, tyres, suspension and interaction of direct pollutants).
Having zero tailpipe emissions (and therefore no NOx emitted) is a huge benefit to local air quality that could be achieved by shifting to EVs from ICEs especially diesel.
Indirect emissions from EVs have been the subject of negative media coverage, however, mainly allegations that PM emissions (principally from the tyres of heavier EVs) negate any positives.
Primary pollutants are those coming off vehicles while secondary pollutants are caused by the interaction of pollutants that don’t get emitted directly but are formed as a result of road travel. While primary particle mass (PM) emissions may be slightly elevated in EVs versus ICE, secondary PM emissions (caused by NOx, hydrocarbons, ammonia) are much lower – in fact they are zero. A study by the Organisation for Economic Co-operation and Development (OECD) showed these secondary PM emissions accounted for 29% of total PM emissions for ICE vehicles. When looking at total PM emissions (primary and secondary) EV cars contribute less PM2.5 and PM10 than ICE cars.[8]
Undoubtably, reducing PM emissions from tyres and braking should be a continued focus having reduced the NOx and PMs coming out of an ICE tail pipe (with an EV). But EVs improve local air quality considerably when replacing ICEs.
It is worth noting that smaller EVs have fewer environmental externalities than large ones – so as ever, EVs that are lighter, less materials intensive, and with fewer embedded emissions in their construction are best. Do you really need warp speed acceleration, four-wheel drive and over 400 miles range? If not, go for a more reasonably specified model – the environmental benefits will be greater. That said, the technology in larger EVs and higher margins for OEMs (Original Equipment Manufacturers) do eventually trickle down in to smaller, more affordable EVs.
The eventual substitution of ICEs by EVs will take time and this trend will not move in a straight line. The current (Q1-2024) malaise in the adoption of EVs by private buyers is driven by a lack of a wider range of cheaper EV models, concerns about the lack of charging infrastructure, higher upfront costs (even if they are cheaper to run), as well as steep financing costs. The initial wave of early adopters has potentially happened, and it will take time before the main cohort of consumers adopts EVs wholeheartedly. It is worth remembering however, that the UK now has a million EVs, something that few thought was possible a decade ago. There are headwinds to EV adoption, but we believe these will be relatively short lived as the barriers to EV adoption are addressed. We still think that by 2030/35 the vast majority of new passenger vehicles purchased globally will be EVs.
Conclusion – EV versus ICE total lifecycle comparison
We accept there are negative externalities in producing batteries for electric vehicles. However, overall, we conclude that electric vehicles are better for the environment as compared to internal combustion engine vehicles. This includes the energy and materials used in the battery as well as the improved local air quality as a result of emitting no greenhouse gases and pollutants from the exhaust. We expect this benefit of EVs over ICEs to grow over time as recycled content increases within the battery (2030), as well as improved battery technologies and efficiencies in the drive train. The biggest driver of improvements in EVs over ICE is the carbon intensity of the grid, which we anticipate falling as renewables continue to displace fossil fuels in electricity generation - - something which is increasingly being driven by the economic competitiveness of renewables. Add in regulation to decarbonise and we think the rate of these improvements is generally underestimated.
[1] EEA Report (No 10/2019) Air quality in Europe – 2019 report, www.eea.europa.eu/publications/air-quality-in-europe-2019
[2] www.oecd-ilibrary.org/sites cited in www.epha.org/electric-vehicles-and-air-pollution-the-claims-and-the-facts/
[3] Berenberg 13-Mar-2023 – Fireside chat with Rainbow Rare Earth CEO (RBW LN)
[4] Producing gasoline and diesel emits more CO2 than we thought - IO (innovationorigins.com)
[5] 50% recycled material at 70% reduction in GHG due to recycled rather than primary battery materials; 25% decrease in carbon intensity of grids; 20% increase in EV efficiency (kWh/km from 0.19 to 0.23). ICE fuel efficiency improvements of 10% by 2030/35.
[6] www.ourworldindata.org/grapher/carbon-intensity-electricity?tab=table 2022 estimates
[7]IEA, Comparative life-cycle greenhouse gas emissions of a mid-size BEV and ICE vehicle, IEA, Paris www.iea.org/data-and-statistics/charts/comparative-life-cycle-greenhouse-gas-emissions-of-a-mid-size-bev-and-ice-vehicle, IEA. Licence: CC BY 4.0
KEY RISKS
Past performance is not a guide to future performance. The value of an investment and the income generated from it can fall as well as rise and is not guaranteed. You may get back less than you originally invested.
The issue of units/shares in Liontrust Funds may be subject to an initial charge, which will have an impact on the realisable value of the investment, particularly in the short term. Investments should always be considered as long term.
The Funds managed by the Sustainable Future Team:
Are expected to conform to our social and environmental criteria. May hold overseas investments that may carry a higher currency risk. They are valued by reference to their local currency which may move up or down when compared to the currency of a Fund. May hold Bonds. Bonds are affected by changes in interest rates and their value and the income they generate can rise or fall as a result; The creditworthiness of a bond issuer may also affect that bond's value. Bonds that produce a higher level of income usually also carry greater risk as such bond issuers may have difficulty in paying their debts. The value of a bond would be significantly affected if the issuer either refused to pay or was unable to pay. May encounter liquidity constraints from time to time. The spread between the price you buy and sell shares will reflect the less liquid nature of the underlying holdings. May invest in companies listed on the Alternative Investment Market (AIM) which is primarily for emerging or smaller companies. The rules are less demanding than those of the official List of the London Stock Exchange and therefore companies listed on AIM may carry a greater risk than a company with a full listing. May invest in smaller companies and may invest a small proportion (less than 10%) of the Fund in unlisted securities. There may be liquidity constraints in these securities from time to time, i.e. in certain circumstances, the fund may not be able to sell a position for full value or at all in the short term. This may affect performance and could cause the fund to defer or suspend redemptions of its shares. May, under certain circumstances, invest in derivatives, but it is not intended that their use will materially affect volatility. Derivatives are used to protect against currencies, credit and interest rate moves or for investment purposes. There is a risk that losses could be made on derivative positions or that the counterparties could fail to complete on transactions. The use of derivatives may create leverage or gearing resulting in potentially greater volatility or fluctuations in the net asset value of the Fund. A relatively small movement in the value of a derivative's underlying investment may have a larger impact, positive or negative, on the value of a fund than if the underlying investment was held instead. The use of derivative contracts may help us to control Fund volatility in both up and down markets by hedging against the general market. The use of derivative instruments that may result in higher cash levels. Cash may be deposited with several credit counterparties (e.g. international banks) or in short-dated bonds. A credit risk arises should one or more of these counterparties be unable to return the deposited cash. Outside of normal conditions, may hold higher levels of cash which may be deposited with several credit counterparties (e.g. international banks). A credit risk arises should one or more of these counterparties be unable to return the deposited cash. May be exposed to Counterparty Risk: any derivative contract, including FX hedging, may be at risk if the counterparty fails. Do not guarantee a level of income.
The risks detailed above are reflective of the full range of Funds managed by the Sustainable Future Team and not all of the risks listed are applicable to each individual Fund. For the risks associated with an individual Fund, please refer to its Key Investor Information Document (KIID)/PRIIP KID.
DISCLAIMER
This is a marketing communication. Before making an investment, you should read the relevant Prospectus and the Key Investor Information Document (KIID), which provide full product details including investment charges and risks. These documents can be obtained, free of charge, from www.liontrust.co.uk or direct from Liontrust. Always research your own investments. If you are not a professional investor please consult a regulated financial adviser regarding the suitability of such an investment for you and your personal circumstances.
This should not be construed as advice for investment in any product or security mentioned, an offer to buy or sell units/shares of Funds mentioned, or a solicitation to purchase securities in any company or investment product. Examples of stocks are provided for general information only to demonstrate our investment philosophy. The investment being promoted is for units in a fund, not directly in the underlying assets. It contains information and analysis that is believed to be accurate at the time of publication, but is subject to change without notice. Whilst care has been taken in compiling the content of this document, no representation or warranty, express or implied, is made by Liontrust as to its accuracy or completeness, including for external sources (which may have been used) which have not been verified.