The S&P 500 fell sharply in Q2 as concerns grew about rising inflation and the negative impact of the Federal Reserve’s tightening cycle on economic growth. The Fund underperformed the S&P 500 by 0.7% (Z share class, net of fees, USD) during this volatile quarter.
There are two main headwinds facing the market currently. First, economic growth is slowing as the Fed tightens monetary policy, as we leave behind pandemic stimulus and as high inflation reduces discretionary spending. Second, bond yields rising rapidly in anticipation of the Fed hiking interest rates to kill off inflation has increased the discount rate and compressed valuation multiples. This impact is particularly acute for companies with high multiples, so the share prices of cyclical and high growth companies have performed poorly.
Performance review
Our defensive holdings performed well and contributed positively to performance. These included our healthcare holdings in Merck, Elevance (formerly known as Anthem), and Centene. The market is clearly nervous about the prospect of a potential recession and companies that have traditionally been economically insensitive have performed well. Other strong performers include Hasbro and EA, which both reported earnings and forward guidance that were well received by the market.
Detractors to performance include Netflix, Sabre, Intercontinental Exchange and Amazon. Netflix reported poor subscriber growth and forward guidance in their Q1 earnings. Sabre, which connects airlines to travel agents, was impacted by negative sentiment from high oil prices and economic fears, both of which may impact demand for travel. Intercontinental Exchange made a bid to acquire Black Knight, a mortgage tech company, which was poorly received by the market. And Amazon reported weak earnings as they lapped strong numbers from Covid last year.
Broadly speaking, given macro fears and rising bond yields, defensive companies on low valuations have performed well and cyclical companies with high valuations have performed poorly.
Inflation
In this newsletter we will examine the outlook for inflation and why disinflationary forces are likely to be building in the economy. This could put downward pressure on inflation in the months to come, allowing the Fed to ‘pivot’ and begin to loosen monetary policy. Bond yields could fall in this environment and stocks that would benefit from lower bond yields, such as those on high multiples, could disproportionately benefit.
The chart in Fig. 1 below breaks down the contribution of the main categories to the US Consumer Price Index (CPI). Prior to Covid, CPI was mainly driven by services inflation. Commodities such as Food and Energy fluctuated but they were relatively minor contributors over time. Goods was a disinflationary category for many years with ever-improving functionality in consumer electronics and cheap imports flooding American shelves.
That began to change in 2021 as Covid hit supply chains. Goods inflation spiked higher as economic stimulus measures stoked demand and retailers struggled to replenish shelves. At the same time, Food and Energy prices grew strongly as transportation bounced back after lockdowns and OPEC+ exhibited strong discipline in maintaining agreed cuts to oil production. Food and Energy prices often move concurrently as natural gas is used to produce fertilisers and corn ethanol is blended with gasoline. Services inflation also increased as shelter inflation increased with rising house prices and rents.
Fig. 1: The main contributors to year-on-year US CPI inflation
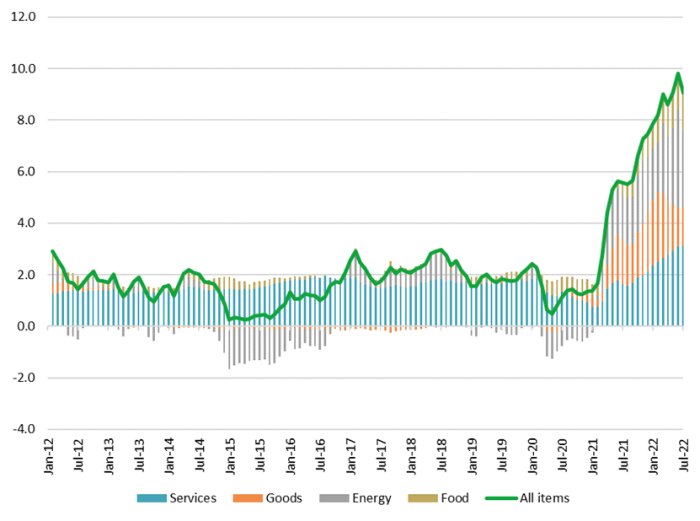
Source: Bloomberg, 19.08.22
We will examine the outlook of each component in turn, starting with Goods inflation. The chart in Fig. 2 below breaks down the various components of Goods inflation and its contribution to CPI. The biggest contributor post-Covid has been ‘Transportation Commodities Less Motor Fuel’, i.e. new and used cars. This has been driven by the well-documented semiconductor shortages in the autos supply chain, which has limited production of new cars. This has impacted car inflation in two ways. First, new cars became more expensive as manufacturers funnelled what semiconductor supply they had towards their most profitable high-end models. Second, the lack of supply of new cars drove up prices for used cars.
Fig. 2: Goods’ contribution to year-on-year CPI inflation
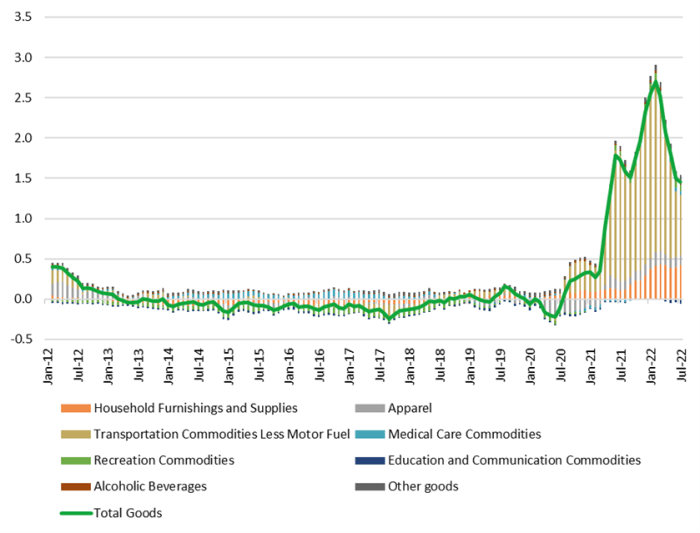
Source: Bloomberg, 19.08.22
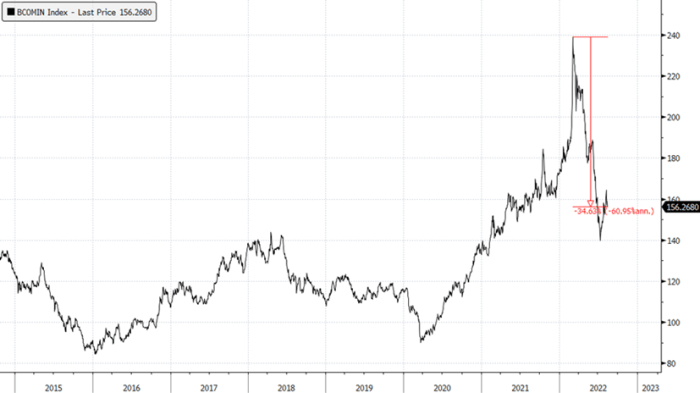
The Manheim Used Car Index below (Fig. 3) indicates that used car prices increased more than 60% in the US throughout 2021. A quick search online suggests I could sell my car now for more than its purchase price in September 2020! Clearly, this environment is not sustainable. Used car prices will normalise at some point and we have started to see prices softening in the first half of 2022. Surprisingly, this has not been driven by supply but demand. Supply remains constrained, although it is expected to improve in H2 2022 and 2023. Demand has been the main culprit as stimulus ends and interest rates rise, increasing monthly financing payments. Our expectation is that used car prices continue to normalise as supply improves in the coming months. The magnitude of the potential correction could mean Goods inflation becomes a deflationary contributor to CPI.
Fig. 3: Performance of the Mannheim Used Car Index over the last two decades
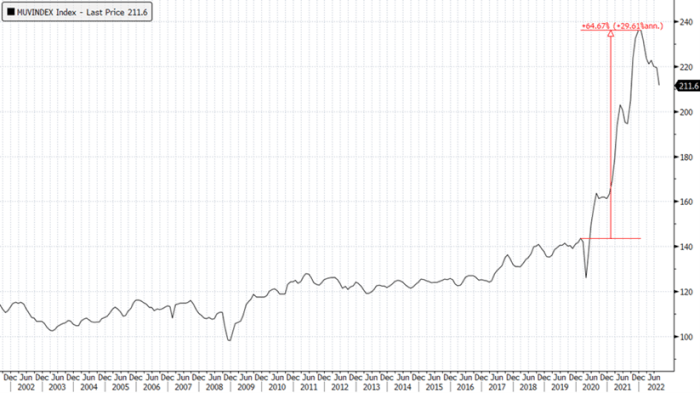
Source: Bloomberg, 19.08.22
In other Goods categories we have also seen supply improving as demand begins to cool. There have been well-publicised excess inventory issues at retailers such as Walmart and Target. Retailers have had to start discounting again. But logistics bottlenecks are clearing and freight rates are beginning to normalise, as shown by the Shanghai Containerised Freight Index (Fig. 4).
Fig. 4: Performance of the Shanghai Containerised Freight Index over the last decade
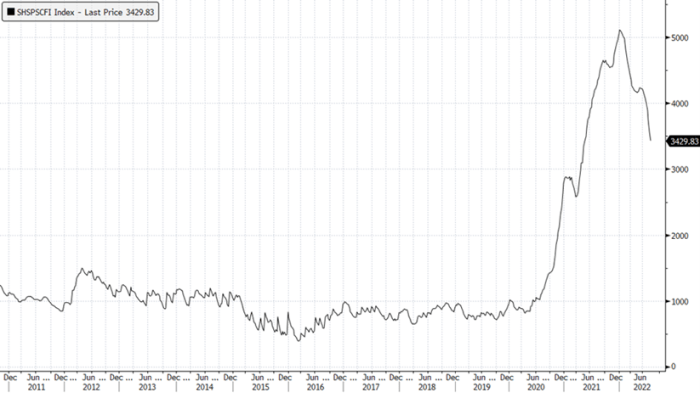
Source: Bloomberg, 19.08.22
Input costs are also falling as metals prices corrected sharply with expectations of slowing growth, particularly in the Chinese property sector. For many metals, such as copper, China accounts for more than 50% of global demand. The Bloomberg Industrial Metals Index, as shown in Fig. 5 below, has fallen 35% from its peak in early 2022. This should start feeding into Goods prices in due course.
Fig. 5: The Bloomberg Industrial Metals Index, 2015 to 2022
Source: Bloomberg, 19.08.22
Moving on to Energy, oil prices peaked in March and are now down more than 25%. The Russian invasion of Ukraine and the subsequent sanctions imposed by the west (including self-sanctioning by western refiners) initially stoked fears of potential oil shortages. However, reduced demand for Russian barrels from Europe has been replaced by demand from India and China, as shown in Fig. 6.
Fig. 6: Russia’s Seaborne Crude
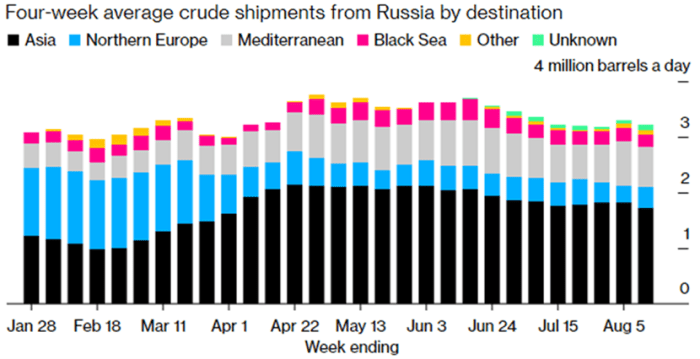
Source: Vessel tracking data monitored by Bloomberg, 15.08.22
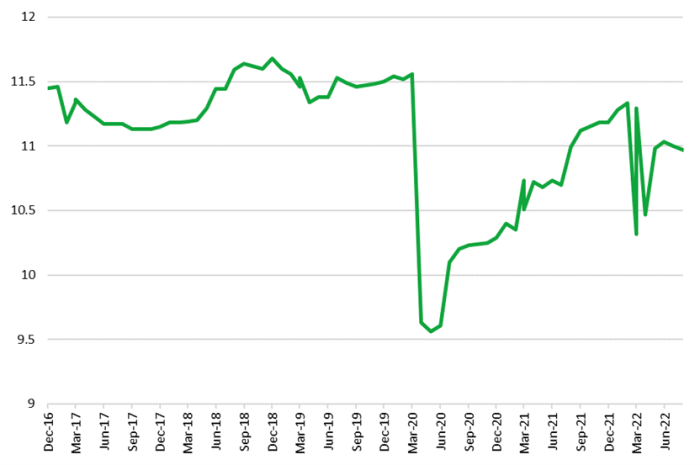
Russian oil production has also recovered from its initial post-invasion dip to 11mb/d (See Fig. 7). A far smaller impact than initial fears of a c.3-4mb/d loss.
Fig. 7: Russia Petroleum Production, million barrels per day (mb/d), December 2016 to June 2022
Source: EIA, 19.08.22
Oil’s supply and demand balance is also now estimated to be in surplus as of Q2, according to the US Energy Information Agency (EIA). This corroborates with inventory data that shows global inventory draws have more or less stopped in recent months (See Fig. 8).
Fig. 8: Global inventories, September 2014 to July 2022
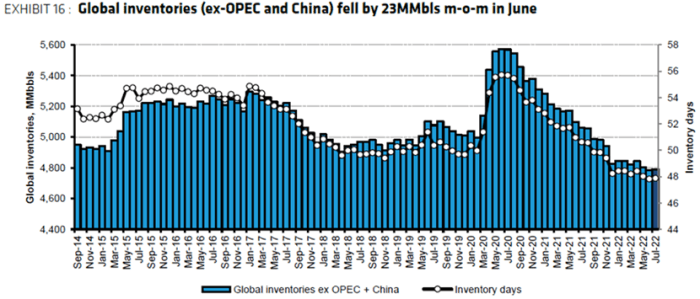
Source: IEA, Bloomberg, Bernstein analysis and estimates, 11.08.22
Oil supply continues to grow, with non-OPEC+ adding an estimated 2.5-3mb/d this year, led by the US. Meanwhile, oil demand is stalling as consumers shun record gasoline prices. US Vehicle Miles Travelled (Fig. 9 below) has been falling since the beginning of the year. Should we see a recession, oil demand could even fall.
Fig. 9: US Vehicle Miles Travelled, December 2001 to June 2022
Source: Bloomberg, 19.08.22
Going into 2023, Russian production could fall by 1.5mb/d as European sanctions start biting at the beginning of 2023. However, between non-OPEC supply growth continuing and demand destruction due to high prices and a slowing economy, the market should remain oversupplied. Should the current last-ditch attempt to revive the Iran nuclear deal succeed, the market would be very comfortably oversupplied in 2023 with an additional 1.3mb/d from Iran. Overall, a scenario where oil prices continue to decline into 2023 is certainly a possibility.
Food inflation should also slow in the near term as agricultural commodity prices, as illustrated by the Bloomberg Agricultural Commodities Index (Fig. 10), have also fallen in recent months. There tends to be a lag of up to six months before this feeds into grocery prices. In July, Turkey helped Ukraine and Russia reach a deal to resume grain shipments from Black Sea ports. This should continue to ease soft commodity markets.
Fig. 10: The Bloomberg Agricultural Commodities Index, 2019-2022
Source: Bloomberg, 19.08.22
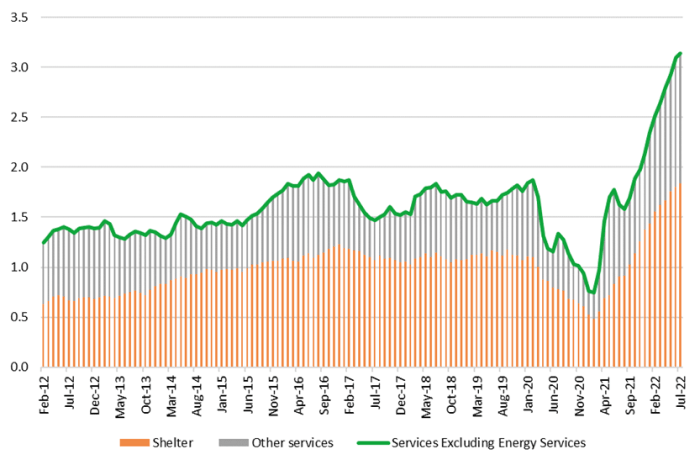
Finally, let us examine Services inflation (Fig. 11). Shelter inflation makes up about 60% of the weighting within Services inflation. It mainly consists of housing costs, including rents. It has been the main driver of the recent increase in Services inflation as house prices and rents rise.
Fig. 11: Services contribution to year-on-year CPI inflation
Source: Bloomberg, 19.08.22
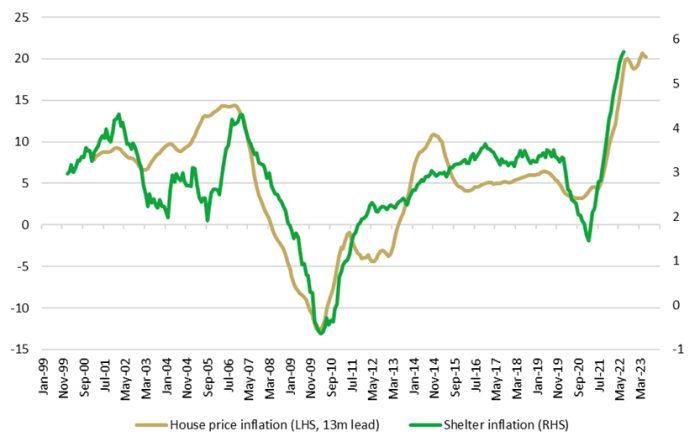
Shelter inflation is a relatively sticky category. There is a long lag between changes in house prices and Shelter inflation because of the way it is calculated by the Bureau of Labour Statistics. Our correlations show that Shelter inflation lags house prices by 13 months (Fig. 12).
Fig. 12: House price inflation versus Shelter inflation
Source: Bloomberg, 19.08.22
Furthermore, house price inflation itself lags broader housing market activity, such as Existing Home Sales volumes, by nine months (Fig. 13). In recent months, we have seen a significant cooling in activity as mortgage rate rises, driven by Fed tightening, have impacted affordability.
Fig. 13: House price inflation versus existing home sales
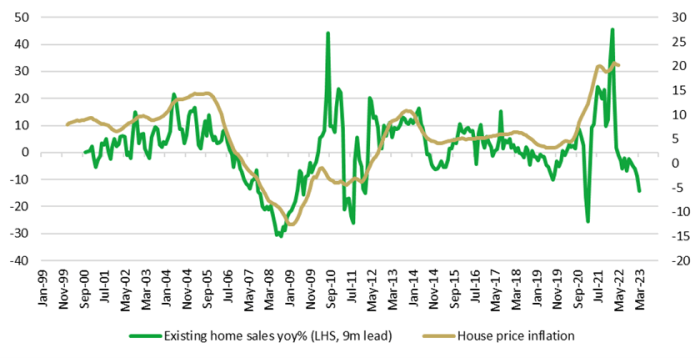
Source: Bloomberg, 19.08.22
Given these long lags, despite the sharp downturn in the housing market in recent months, we will likely only see Shelter inflation peak towards the end of 2022, and it will likely remain high before fading in the back half of 2023.
In summary, despite sticky Shelter inflation, we see disinflationary forces providing downwards pressure on Goods, Energy and Food inflation in the near to medium term. This is driven by normalising supply chains, in particular normalising used car prices, and demand destruction for crude oil as economic growth slows. Indeed, recessions were historically disinflationary/deflationary affairs, and we think this time will prove no different should the current growth slowdown become a recession. Covid created a unique environment of increasing demand for goods consumption from stimulus and lockdowns and constrained supply from bottlenecks. This mix is in the process of reversing as demand is hit by rising costs and fading stimulus and supply chains ease with the addition of new capacity. This inflation may prove transitory after all.
This view corroborates with lead indicators of inflation such as the ISM Services PMI Prices Paid Index (blue line in Fig. 14). This series has historically led CPI by two months and is indicating an imminent deceleration in inflation in the coming months.
Fig. 14: ISM Services PMI Prices Paid Index as a leading indicator of CPI
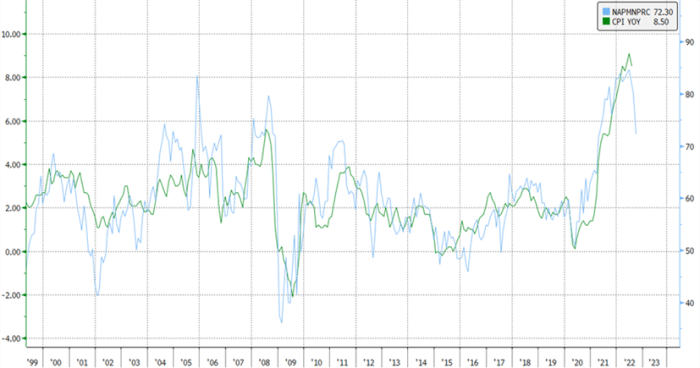
Source: Bloomberg, 19.08.22
We could see inflation fade in the coming months as lower food, energy and goods prices feed into CPI. This could reduce the pressure on the Fed to raise rates and allow them to pivot to lower incremental rises or even pause. In this scenario, bond yields would likely decline and benefit higher multiple stocks as discount rates fall.
We have adjusted the portfolio in recent months to benefit from this outcome. We have added new positions in higher growth names such as Intuit, the tax and accounting software developer. Its SaaS subscription model should also make it fairly resilient in a downturn. Tax and accounting tend not to be areas of discretionary spend. We have also added a new position in LGI Homes, an entry level homebuilder. It has a unique model which generates 30% return on equity, one of the highest in the industry. Falling bond yields should improve affordability and stimulate the housing market. Both these shares have underperformed significantly against the market over the last 6-12 months because of rising bond yields. This provides a very attractive entry point into two high quality businesses.
Transactions
Over the quarter we took new positions in Sabre, Vertex Pharmaceuticals, Intuit and LGI Homes, as mentioned above. Sabre should benefit from reopening after Covid and from the return of business travel. It should not be overly economically sensitive as it takes commissions based on booking volume, not ticket prices. In 2009, industry passenger kilometres were only down 1% year-on-year. Vertex Pharmaceuticals produces drugs for the treatment of cystic fibrosis. It is unique in that unlike other large pharma companies, it does not face a patent cliff in the next 5-10 years. Its main patent expires in 2037. Potential competitor drugs in development have recently failed and Vertex’s own pipeline has reported strong data.
We exited positions in GXO Logistics, XPO Logistics, Autodesk, Nvidia, Micron, Vertiv and Charles Schwab. To generalise, these are more economically sensitive names that are likely to perform poorly in a slowing or negative growth environment. Logistics markets have been weakening as retailers deal with excess inventories. Semiconductor demand is weakening as consumer spending on computers and consumer electronics slow. We have been recycling capital from these holdings to new names mentioned previously where the upside/downside potential is much more skewed in our favour.
Outlook
Our view is that economic growth likely slows further from here and there is the risk of a recession. This is because we are currently in an acute cycle of monetary tightening. Historically, the full impacts of monetary policy on the economy have long lags of up to 18 months. This means the negative impacts of the current tightening cycle could last well into 2023. Yet lead indicators such as Manufacturing PMIs have yet to materially weaken. The July reading was 52.8, still indicating expansion. It may mean we are still early in the cycle of slowing growth.
On bond yields and inflation, our view is more positive. Slowing growth will likely help reduce inflation and lead to lower bond yields as the market prices in fewer rate hikes or even future rate cuts. Goods inflation has very likely peaked, with freight rates falling, companies reporting excess inventory and falling used car prices. Commodity prices are also rolling over. This should benefit growth-oriented stocks on higher multiples.