Market backdrop
In its latest meeting minutes, the Federal Open Market Committee stated “…participants generally noted that they did not expect it would be appropriate to reduce the target range for the federal funds rate until they had gained greater confidence that inflation was moving sustainably toward 2 percent”. The key here is the desire for gaining greater confidence, which will require more data providing evidence of a sustainable fall in inflation. The first two months of 2024 has seen economic data stronger than consensus on more occasions than not. Given the importance of the current inflation data, it is the focus of this market backdrop commentary.
Headline US consumer price inflation (CPI) was above expectations at 3.1% (consensus 2.9%, prior 3.4%); core CPI also overshot expectations by remaining at 3.9% (consensus 3.7%, prior 3.9%). About 0.05% of the overshoot was due to owners’ equivalent rents (OER), but other services inflation was also stronger than expected. We believe that the strength in OERs will either be an aberration, or last for five months, but either way will be fading in the second half of the year. The other services inflation causes greater concern.
Firstly, examining shelter inflation, whose largest components are rents and owners’ equivalent rents, the monthly change in these is plotted below on the left-hand axis:
Monthly rents, OERs, and the difference
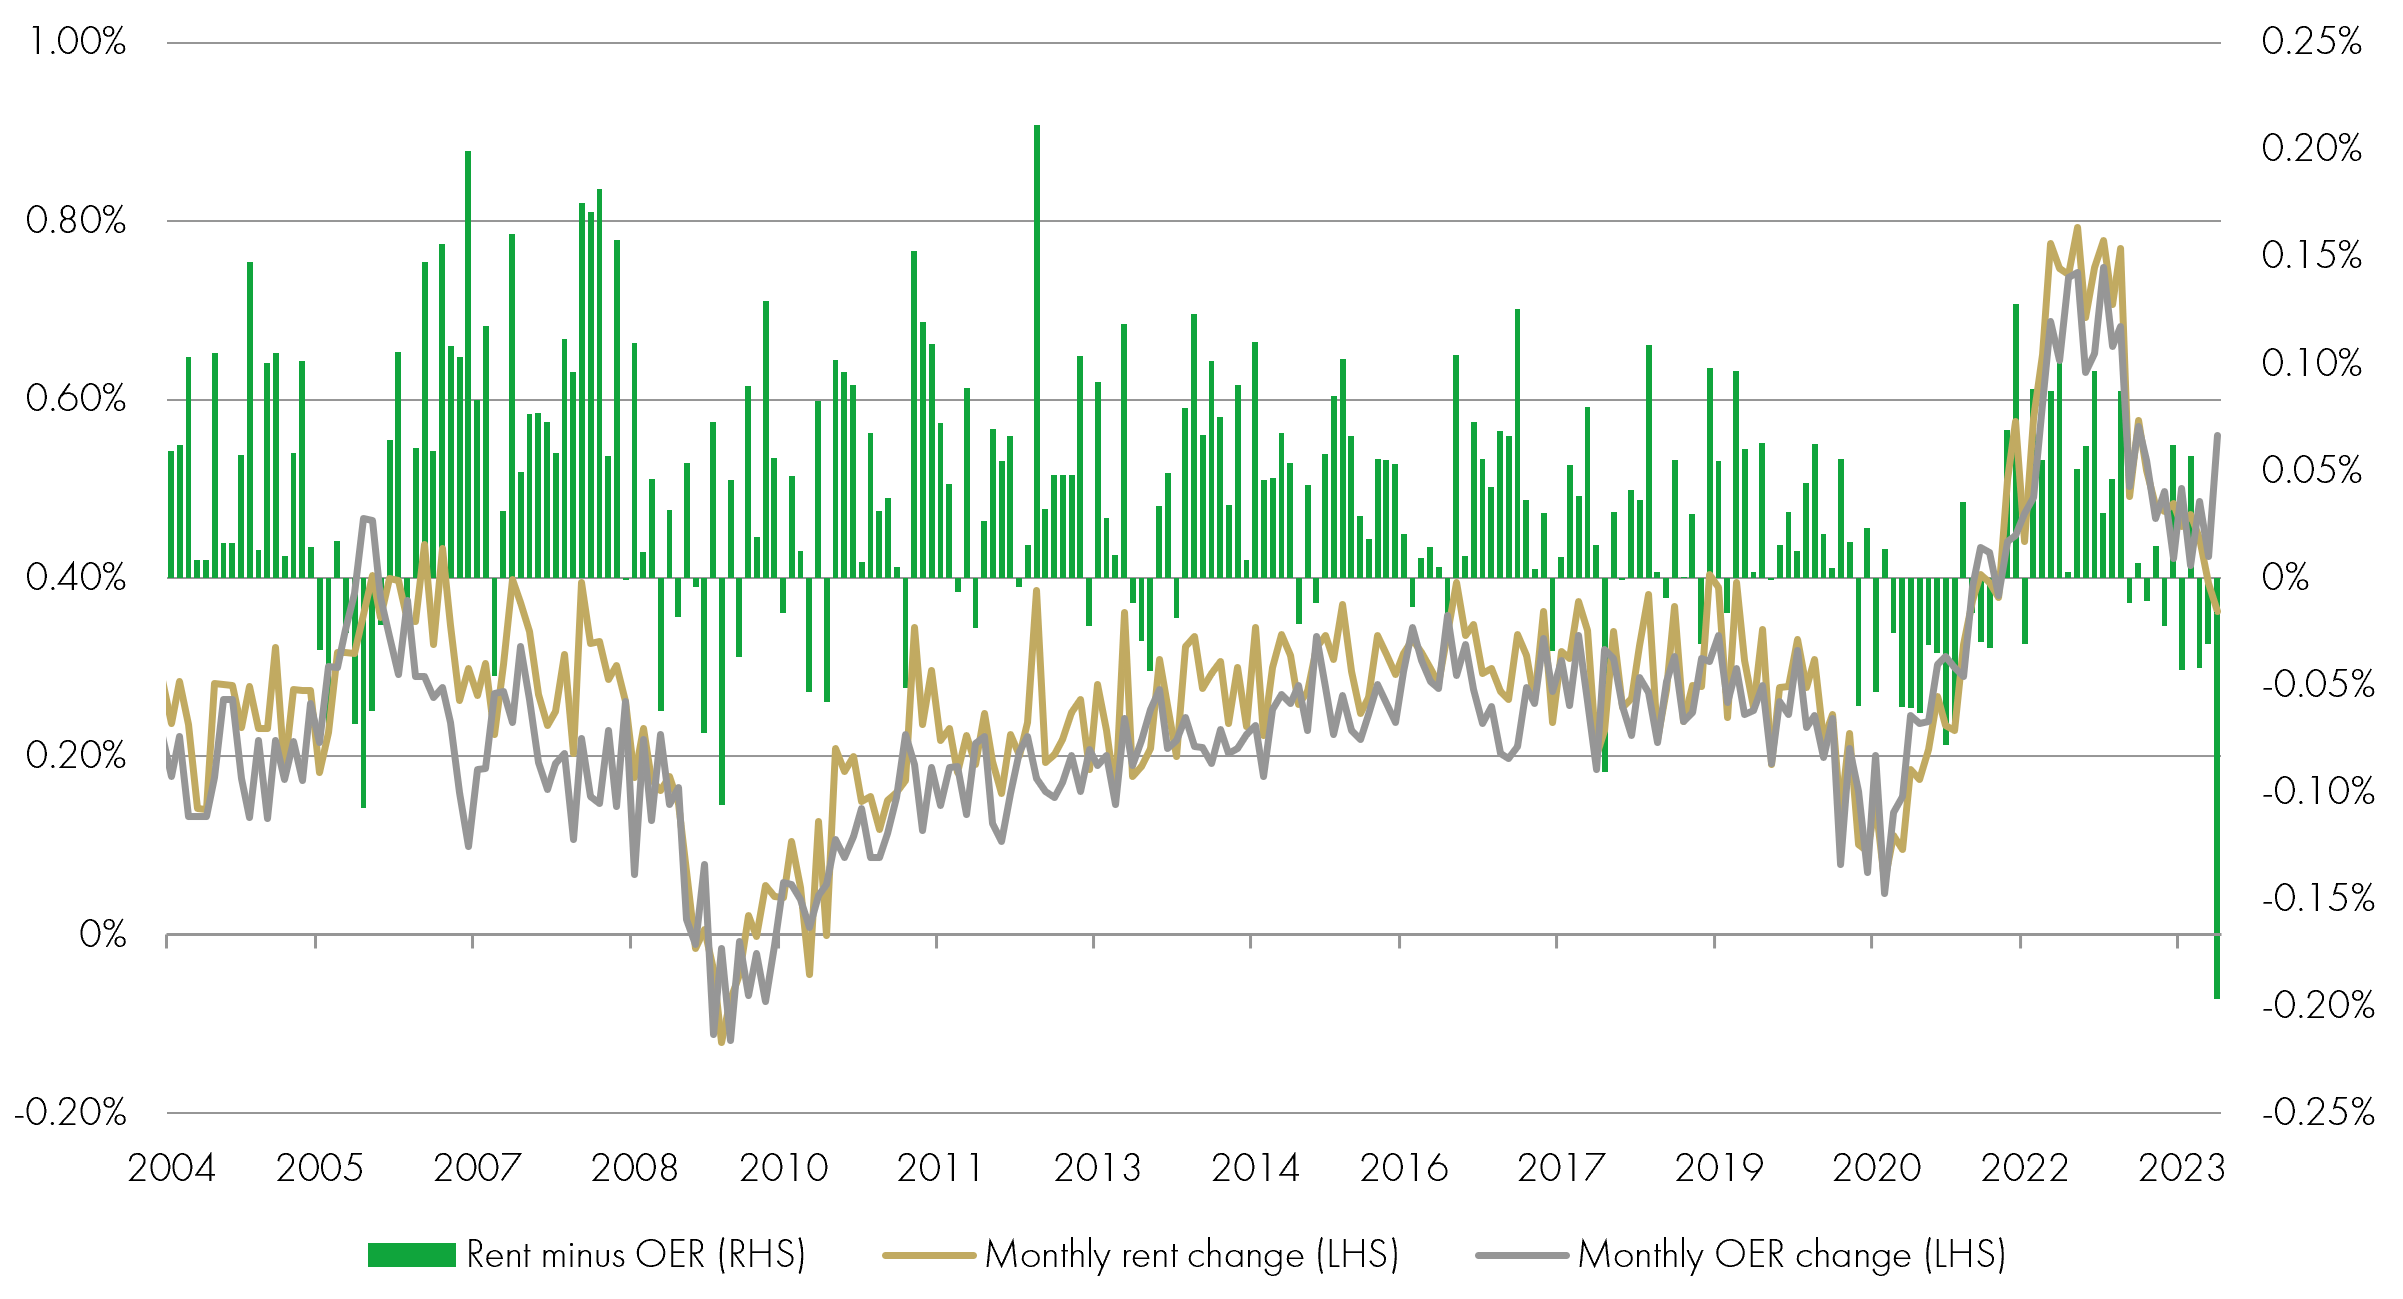
Source: BLS, Bloomberg, Liontrust, as at 31.01.24
It can be clearly seen that both rents (gold line) and OERs (grey line) spend most of the time with a monthly inflation rate between 0.2% and 0.4%. The spike at the start of 2023 to a run rate around 0.8% per month was due to the strong housing market following re-opening from Covid lockdowns during 2021/2022. The lags embedded into the measurement methodology led to this delay in these shelter inflation categories capturing this. However, as discussed in previous market backdrop commentaries, those same methodological lags are catching up with a much weaker housing market, which naturally leads to a gradual reduction in the run rate of shelter inflation. By the end of 2023, the monthly inflation rate for both rents and OERs was in the 0.4% to 0.5% range. A surprise in January’s CPI data was that OERs inflation jumped back up to 0.56%, but rent inflation was on trend at only 0.36%. On the right-hand axis of the chart above we have plotted the difference between the two data series (green bars); rents tend to inflate a little more than OERs, but the latter can sometimes be larger. The difference between the two series in January at -0.20% is an outlier and this gap is not sustainable over the longer term.
One fascinating development toward the end of February was the Bureau of Labor Statistics (BLS) sending out an email to a chosen few offering up a potential rationale for the surprise jump in owners’ equivalent rents (OER) in the CPI figures earlier in the month; the email was later retracted! The potential rationale the BLS offered was the annual re-weighting, that occurs in January, of its calculations. Specifically, the weighting of single-family rental units has increased by ~5% in the OER calculation. With single-family rent currently higher than multi-family rent, this would have increased OERs. If this was the cause then the effect is likely to linger for another five months. Sampling is done once every six months, so the weighting adjustment would need to flow through the other five panels of properties. Or January’s OER uplift could just transpire to be a data anomaly!
The underlying story of the gradual slowing in shelter inflation is unchanged, but if a methodological adjustment by the BLS is the cause of January’s outlying data, one should expect OERs to be stickier for the next five months. The implications of this are twofold: firstly, the wedge between core CPI and the core PCE deflator would increase – OERs represent ~30% of the former and ~14% of the latter; secondly, and more importantly, it might nudge a couple of Fed monetary policy setters to delay the timing of the first rate cut. If the Fed had not made such a mess of managing inflation in the first place, members could look through this data anomaly, but the need to regain inflation fighting credentials remains at the forefront of minds. Thus, an imputed inflation component that most of the public have not even heard of, let alone understand, could lead to more damage being done to the US economy by restrictive monetary policy than necessary.
Regardless of what transpires with OERs, the Fed will be concerned by January’s big monthly jump in services inflation that excludes housing, a measure referred to as supercore services inflation. January’s monthly spike has taken annual supercore services inflation back up to 4.3%, compared to the rate around 4% that it had been for most of the second half of 2023; the annual rate is shown on the chart below.
CPI core services ex housing (supercore)
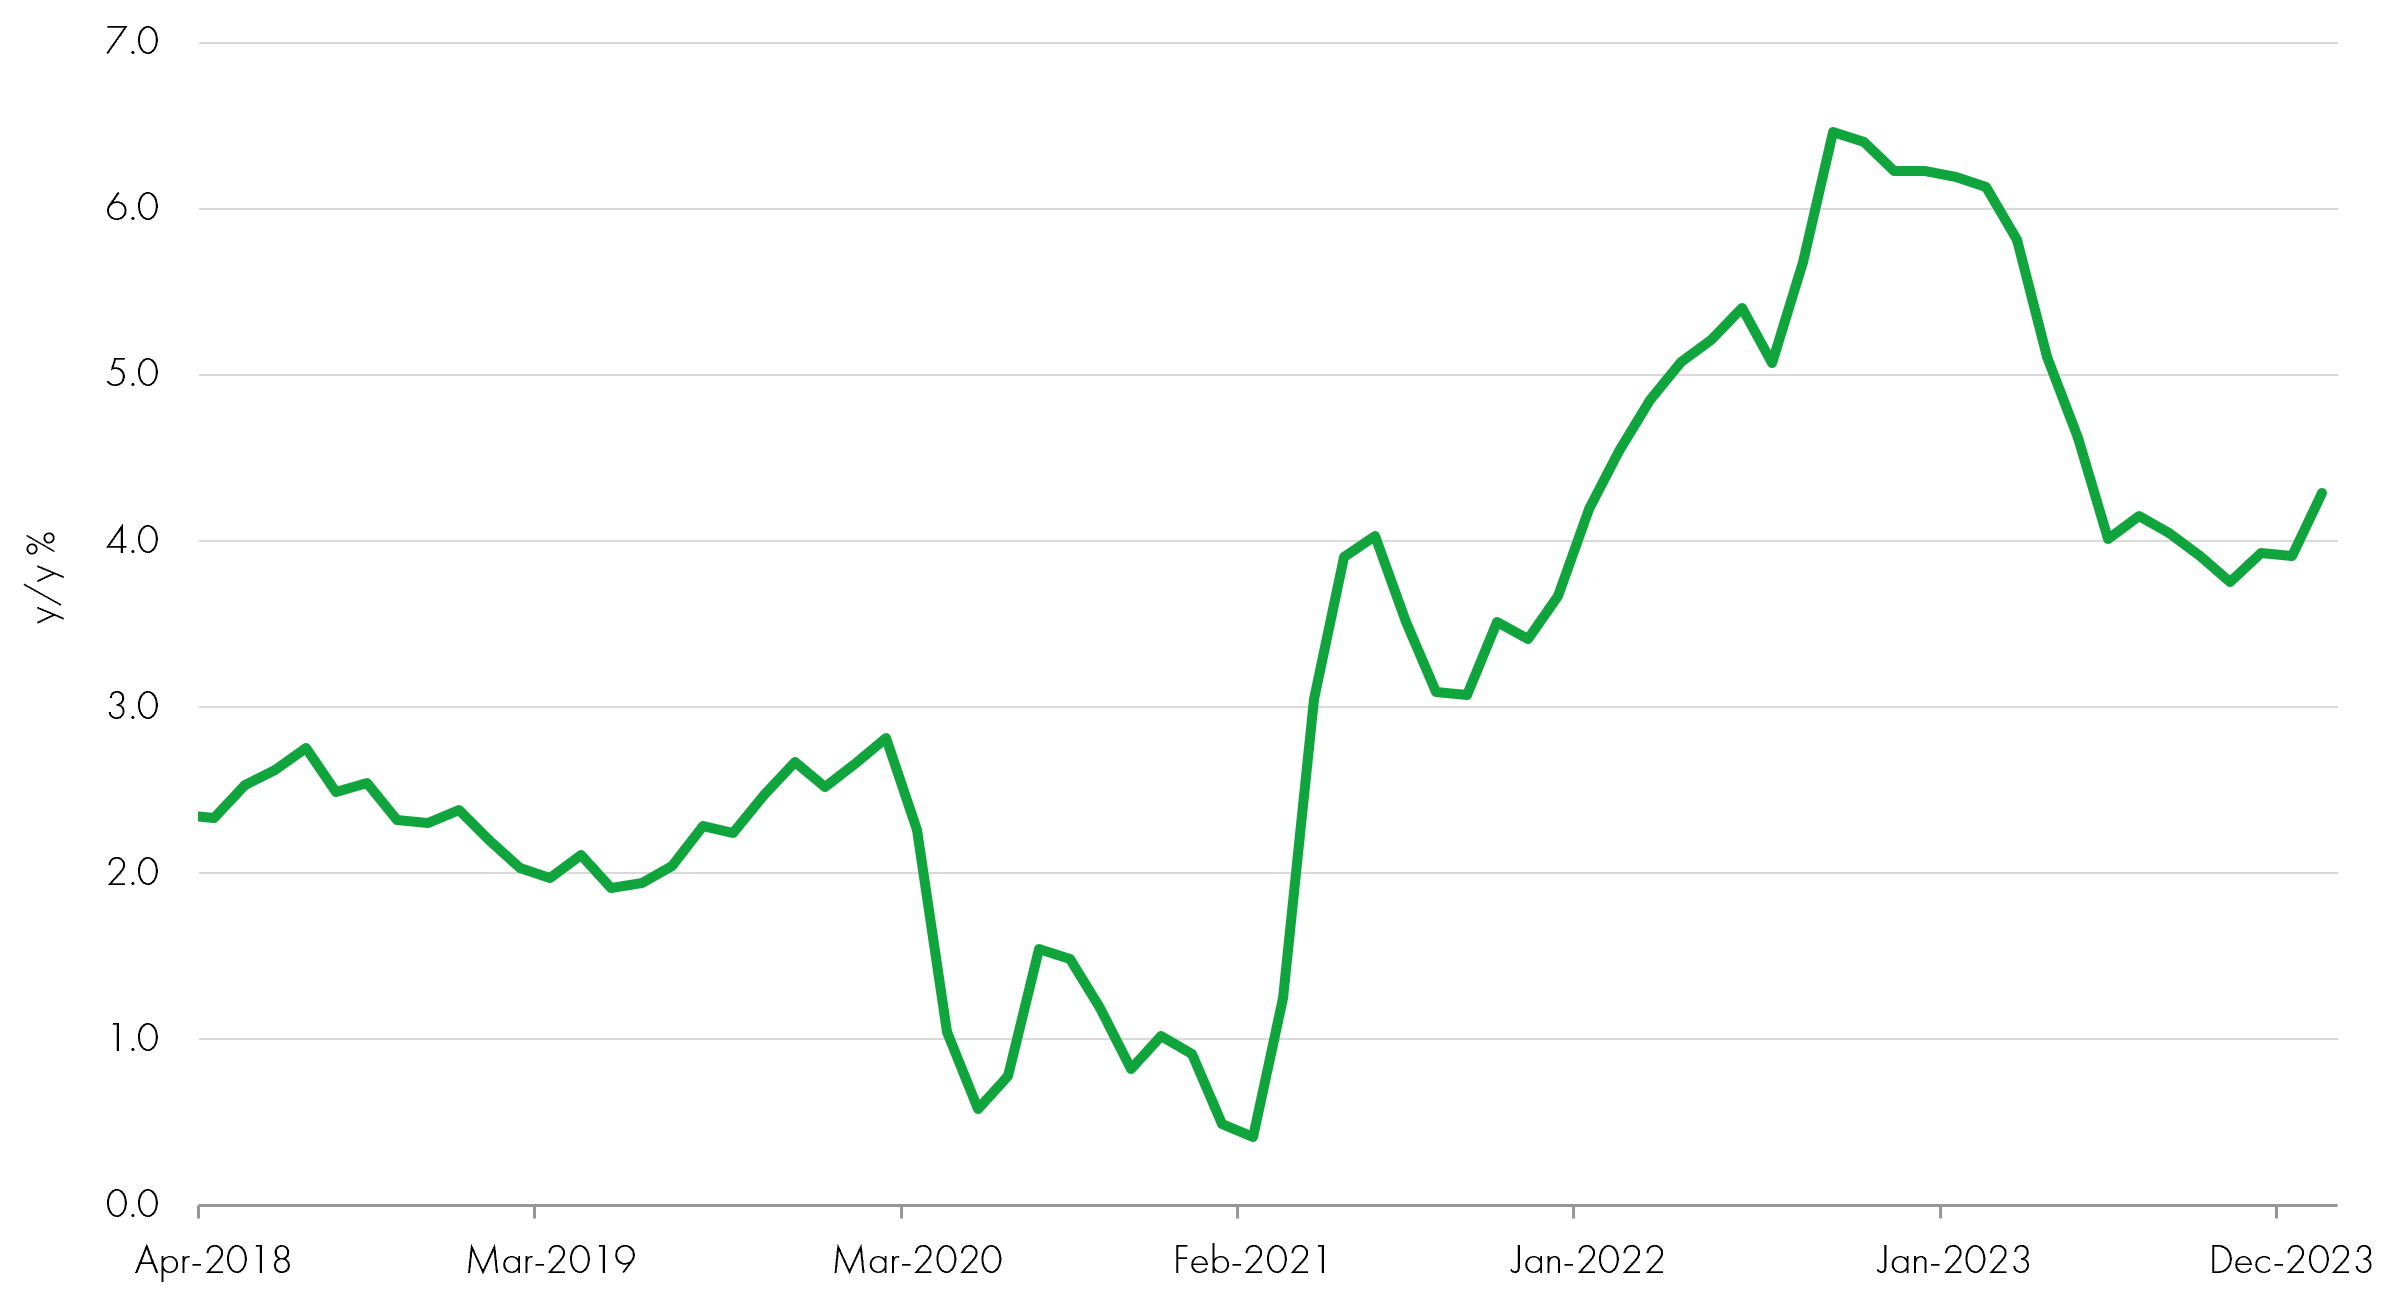
Source: BLS, Bloomberg, Liontrust, as at 31.01.24
As a reminder, supercore services are highly correlated to nominal wage inflation. One of the pressure areas is medical care, with hospital services up 1.6% and physicians’ services up 0.6% in January. An inflationary hump was always likely here as prices catch up to high wage inflation in the prior period; this is likely to persist for at least the first half of 2024. Motor vehicle insurance continues to see outsized rises (up 20.6% over the last year), due to the cost of repairs pertaining to both parts and labour; this should start to fade soon. Outside of these two components, inflation dispersion has increased across other categories.
The overriding message from this CPI data of sticky services inflation will not give the Fed the confidence in inflation being conquered. We think the Fed voting members will veer towards waiting to see some labour market damage before it loosens monetary policy. This is consistent with one of our key macroeconomic themes for 2024 of later but larger rate cuts.
Fund positioning and activity
Rates
With the market no longer fully pricing in a rate cut in the US until the Fed’s July meeting, this gave us the valuation backdrop to be able to increase duration. We added 0.5 years to take overall Fund duration back up to 7.5 years. The geographic split of duration is US 3.4 years, Canada -0.5 years, UK 1.3 years, Europe 2.3 years, and New Zealand 1.0 years. We continue to prefer short-dated and medium-dated bonds; the net duration exposure in the 15+ year maturity bucket is zero.
Allocation
Having reduced investment grade exposure during January, we retained an underweight position during February and focussed on rotating stock picks to generate performance. Credit fundamentals remain strong at the aggregate level. The technical backdrop is very strong with a seemingly insatiable market appetite for corporate bonds, but valuations are expensive. To reiterate what we said last month, credit spreads are the expensive part of the equation, the total yield on corporate bonds is still attractive.
The Fund has 43% net exposure to investment grade credit: 47% in physical bonds and a 4% risk-reducing overlay. In high yield, the net weighting is 15%: 22% of physical exposure and a 7% risk-reducing overlay. The underweight position gives the Fund a lot of risk budget to buy once credit spreads widen. We are targeting adding to credit during a period of volatility as opposed to anticipating a lurch higher in defaults and the permanent destruction of capital.
Selection
The strong credit markets have led to some corporate bonds becoming expensive. We took profits in a few positions in February and recycled the proceeds into better value opportunities. Sales included subordinated bonds issued by Rabobank, Zurich Insurance’s tier 2 debt, and Bayer’s bonds. The latter position is the only one where we had any fundamental concerns – a dividend cut by the company caused the bonds to rally so we sold them; we want to see further progress on dealing with litigation issues before we would reinvest.
The Fund participated in a new issue in LKQ, an alternative car parts provider focusing on replacement parts post collisions. This former high yield darling now has an investment grade balance sheet and we are big fans of the defensive nature of its business.
We also purchased Ardonagh’s bonds. The company is an insurance broker, involved in both property and casualty insurance distribution and specialty insurance broking. We like the structural growth in the end markets, low cyclicality of the industry, capital-light business model, and high customer retention rates. As Ardonagh expands, the company is moving up the value chain to start to look more like a European version of Marsh or Aon. Net leverage is high at 5.5x, and that’s using pro forma EBITDA figures as opposed to reported ones, but the company has the ability to deleverage using cash flow by about 0.5x per annum. The secured euro-denominated bonds purchased are rated B-/B with a coupon of 6.875%, giving a credit spread of about 475 basis points.
Finally, we also purchased debt issued by Kier, a construction company with a large proportion of revenue from public sector contracts. While the construction sector itself is highly cyclical, the long-term contracts that Kier has create great revenue visibility, which is an attribute that we value highly in a bond issuer. Kier had a chequered past – it undertook a rescue rights issue 5 years ago but the new management has turned the company around and de-risked the contracts. The balance sheet has also improved and is forecast to continue to do so, resulting in a broad credit rating of BB (BB- at S&P, BB+ at Fitch). We are attracted to the revenue visibility and continued credit improvement story; with a yield of 9% for 5-year sterling bonds, we think this is an attractive opportunity.
Discrete years' performance (%) to previous quarter-end**:
|
|
Dec-23 |
Dec-22 |
Dec-21 |
Dec-20 |
Dec-19 |
|
Liontrust Strategic Bond B Acc |
8.4% |
-11.3% |
-0.5% |
5.9% |
8.7% |
|
IA Sterling Strategic Bond |
7.8% |
-11.0% |
0.8% |
6.6% |
9.3% |
|
Quartile |
2 |
3 |
3 |
3 |
3 |
**Source: Financial Express, as at 31.12.23, accumulation B share class, total return (net of fees and income reinvested).* Source: Financial Express, as at 29.02.24, accumulation B share class, total return (net of fees and income reinvested).
For a comprehensive list of common financial words and terms, see our glossary at:
https://www.liontrust.co.uk/benefits-of-investing/guide-financial-words-terms
KEY RISKS
Past performance is not a guide to future performance. The value of an investment and the income generated from it can fall as well as rise and is not guaranteed. You may get back less than you originally invested.
The issue of units/shares in Liontrust Funds may be subject to an initial charge, which will have an impact on the realisable value of the investment, particularly in the short term. Investments should always be considered as long term.
The fund manager considers environmental, social and governance (""ESG"") characteristics of issuers when selecting investments for the Fund. Bonds are affected by changes in interest rates and their value and the income they generate can rise or fall as a result; The creditworthiness of a bond issuer may also affect that bond's value. Bonds that produce a higher level of income usually also carry greater risk as such bond issuers may have difficulty in paying their debts. The value of a bond would be significantly affected if the issuer either refused to pay or was unable to pay. Overseas investments may carry a higher currency risk. They are valued by reference to their local currency which may move up or down when compared to the currency of the Fund. The Fund can invest in derivatives. Derivatives are used to protect against currency, credit or interest rate moves or for investment purposes. There is a risk that losses could be made on derivative positions or that the counterparties could fail to complete on transactions. The Fund uses derivative instruments that may result in higher cash levels. Cash may be deposited with several credit counterparties (e.g. international banks) or in short-dated bonds. A credit risk arises should one or more of these counterparties be unable to return the deposited cash. The Fund invests in emerging markets which carries a higher risk than investment in more developed countries. This may result in higher volatility and larger drops in the value of the fund over the short term. The Fund may encounter liquidity constraints from time to time. Participation rates on advertised volumes could fall reflecting the less liquid nature of the current market conditions. Counterparty Risk: any derivative contract, including FX hedging, may be at risk if the counterparty fails.
DISCLAIMER
This is a marketing communication. Before making an investment, you should read the relevant Prospectus and the Key Investor Information Document (KIID), which provide full product details including investment charges and risks. These documents can be obtained, free of charge, from www.liontrust.co.uk or direct from Liontrust. Always research your own investments. If you are not a professional investor please consult a regulated financial adviser regarding the suitability of such an investment for you and your personal circumstances.
This should not be construed as advice for investment in any product or security mentioned, an offer to buy or sell units/shares of Funds mentioned, or a solicitation to purchase securities in any company or investment product. Examples of stocks are provided for general information only to demonstrate our investment philosophy. The investment being promoted is for units in a fund, not directly in the underlying assets. It contains information and analysis that is believed to be accurate at the time of publication, but is subject to change without notice.