The diversification benefits of bonds appear to be returning after disappearing in the market turmoil of 2022. Bonds are traditionally seen as a key diversifier versus equities because their investment returns are expected to be negatively correlated. But this broke down in 2022 as sharply rising interest rates impacted both asset classes.
In its latest quarterly strategy, the Liontrust Global Fixed Income team notes: “With the markets’ collective thoughts turning from the inflationary problems of 2022 to the impending economic slowdown later in 2023, we have seen one relationship pleasingly reassert itself. Namely, the correlation between high quality sovereign bond returns and those on riskier assets has become negative again.”
This is important because owning low or negatively correlated assets is a fundamental principle of diversification, a strategy that – when applied effectively – should reduce expected portfolio volatility without negatively affecting expected investment returns.
Although the correlation of bonds and equities has shifted over time, it is often assumed that a negative correlation is the ‘normal’ relationship suggested by investment theory.
Equities and bonds are usually expected to perform very differently at various points in the economic cycle.
During periods of economic growth, shares in companies might perform well due to rises in profits and investor risk appetite. As the economy heats up, demand for goods and services is likely to push up prices, causing inflation and prompting central banks to raise interest rates to cool things. Rising interest rates would usually imply rising bond yields and falling bond prices through a relationship known as duration.
As economic activity moderates or contracts, this relationship should reverse; shares may perform poorly as companies find it tougher to generate profits growth and as investors look to shift into lower-risk asset classes. A cooling economy would usually lead to interest rate cuts from central banks, which would imply falling bond yields and rising bond prices.
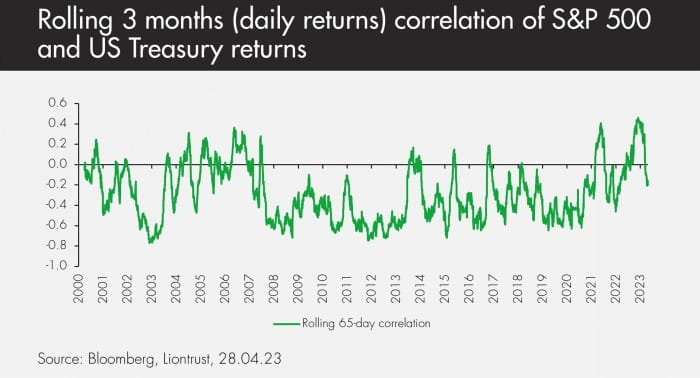
Historically, the correlation of bonds and equities has gone through periods of conforming to the negative relationship described above but it has also been positive at times.
There are several possible reasons why a negative relationship might not hold. The nature of central banks’ monetary policy is one.
If, rather than responding countercyclically to the normal economic cycle (i.e. hiking rates as economic growth and inflation rises, before cutting as they decline), policy was instead responding to unique shocks to the economy, then the negative relationship can break down.
For example, the chart above shows that the decade following the 2008/9 global financial crisis was typically characterised by negative equity/bond correlation broken by episodes of zero or positive correlation. These episodes may be explained by the ultra-low interest rates and huge bond-buying quantitative easing programmes unleashed by key central banks at the time.
Investors during this period may remember bouts in which equities and bonds responded as a homogenous group of risk assets to the provision of each tranche of monetary stimulus – all rising together in response to more cheap money in the economy.
More recently, the chart shows two large spikes of positive correlation in 2021 and 2022. This corresponds to the inflationary supply-side shocks provided by post-Covid lockdown bottlenecks and the Ukraine conflict respectively.
As central banks belatedly accepted that these events were leading to persistent rather than transitory inflation, they started to raise interest rates. Because this inflation stemmed from supply disruption rather than high, cyclical demand, it corresponded to poor returns for both bonds and equities – bond yields rose and prices fell as interest rates went up; equities were weighed down by tighter monetary policy and higher discount rates at a time when economic activity was still disrupted by recovery from Covid and the Ukraine conflict.
This meant that diversification benefits did not apply that strongly in 2022, and a number of well-diversified multi-asset portfolios will have suffered negative returns as both bonds and equities slid.
The return of a negative correlation is therefore likely to be welcomed by multi-asset investors.
It is also a potential boon for our Global Fixed Income team, which notes that bond market volatility has recently been much higher than equity volatility – suggesting that valuation dispersion and active management opportunities may be greater. As fund manager Phil Milburn says: “This points towards greater dislocations having occurred in bond market pricing, which we view as a buying opportunity for duration exposure.”
For more information, see an article by Donald Phillips from the same investment team: “Why bond market volatility is good for strategic investors”

KEY RISKS
Past performance is not a guide to future performance. The value of an investment and the income generated from it can fall as well as rise and is not guaranteed. You may get back less than you originally invested.
The issue of units/shares in Liontrust Funds may be subject to an initial charge, which will have an impact on the realisable value of the investment, particularly in the short term. Investments should always be considered as long term.
Investment in Funds managed by the Global Fixed Income team involves foreign currencies and may be subject to fluctuations in value due to movements in exchange rates. The value of fixed income securities will fall if the issuer is unable to repay its debt or has its credit rating reduced. Generally, the higher the perceived credit risk of the issuer, the higher the rate of interest. Bond markets may be subject to reduced liquidity. The Funds may invest in emerging markets/soft currencies which may have the effect of increasing volatility. Some of the Funds may invest in derivatives. The use of derivatives may create leverage or gearing. A relatively small movement in the value of a derivative's underlying investment may have a larger impact, positive or negative, on the value of a fund than if the underlying investment was held instead.
DISCLAIMER
This is a marketing communication. Before making an investment, you should read the relevant Prospectus and the Key Investor Information Document (KIID), which provide full product details including investment charges and risks. These documents can be obtained, free of charge, from www.liontrust.co.uk or direct from Liontrust. Always research your own investments. If you are not a professional investor please consult a regulated financial adviser regarding the suitability of such an investment for you and your personal circumstances.
This should not be construed as advice for investment in any product or security mentioned, an offer to buy or sell units/shares of Funds mentioned, or a solicitation to purchase securities in any company or investment product. Examples of stocks are provided for general information only to demonstrate our investment philosophy. The investment being promoted is for units in a fund, not directly in the underlying assets. It contains information and analysis that is believed to be accurate at the time of publication, but is subject to change without notice. Whilst care has been taken in compiling the content of this document, no representation or warranty, express or implied, is made by Liontrust as to its accuracy or completeness, including for external sources (which may have been used) which have not been verified. It should not be copied, forwarded, reproduced, divulged or otherwise distributed in any form whether by way of fax, email, oral or otherwise, in whole or in part without the express and prior written consent of Liontrust.