1) Upbeat start to 2023 fuelled by hopes of interest rate peak
Equity markets started the year strongly, helped along by expectations that interest rates would peak in 2023 and swiftly fall. The MSCI World Index of developed markets kicked off with a 7.0% rally in January.
As shown below, futures markets on 31st January were predicting US rates to top out at 5.0% in the middle of the year before being cut back to 4.5% by Christmas.
However, it wasn’t long before these forecasts looked out-of-date, and volatility in rate expectations was a pretty constant feature throughout the year.
US interest rate expectations at the start of 2023
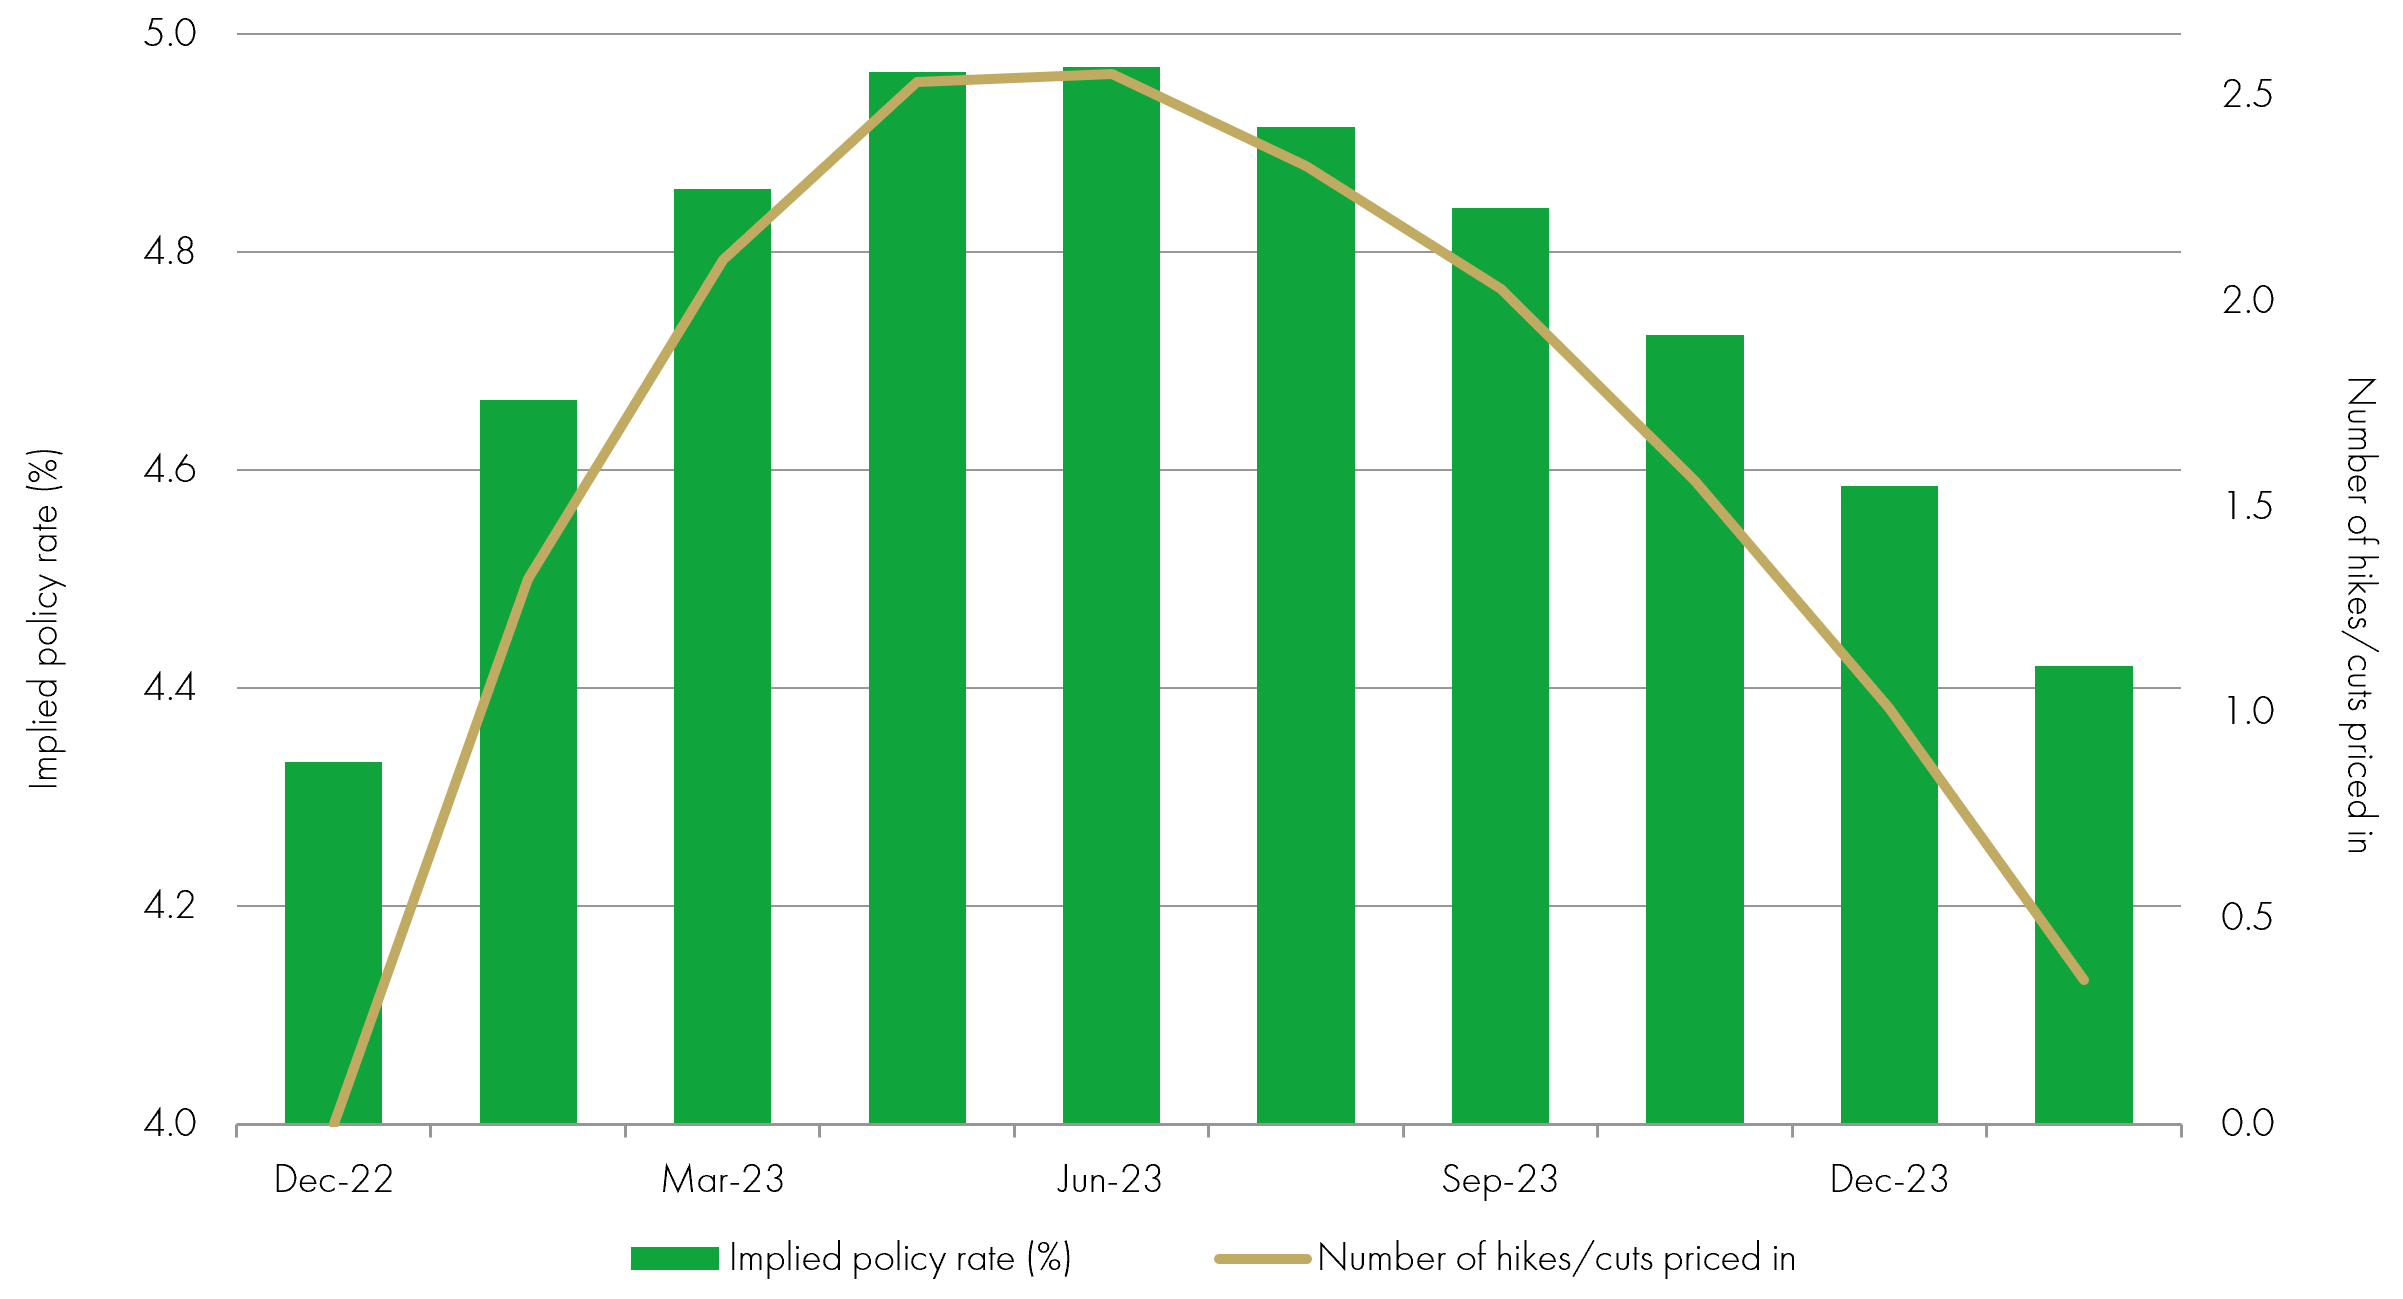
Source: Bloomberg, December 2023
2) These expectations are swiftly abandoned and bond yields move higher
Persistent inflation and surprisingly resilient economic data led investors to raise their interest rate expectations. From the end of January, bond yields of all maturities rose significantly for several months – meaning falling bond prices.
The chart shows the position of the US (government bond) yield curve at the end of January and at the end of October. In simple terms, the yield curve plots the level of yield available on a bond against the length of the loan (the bond’s maturity) in years. We can see here the extent to which the curve shifted up over those nine months, to reflect higher yields across all bond maturities.
US yield curve: January 2023 and October 2023
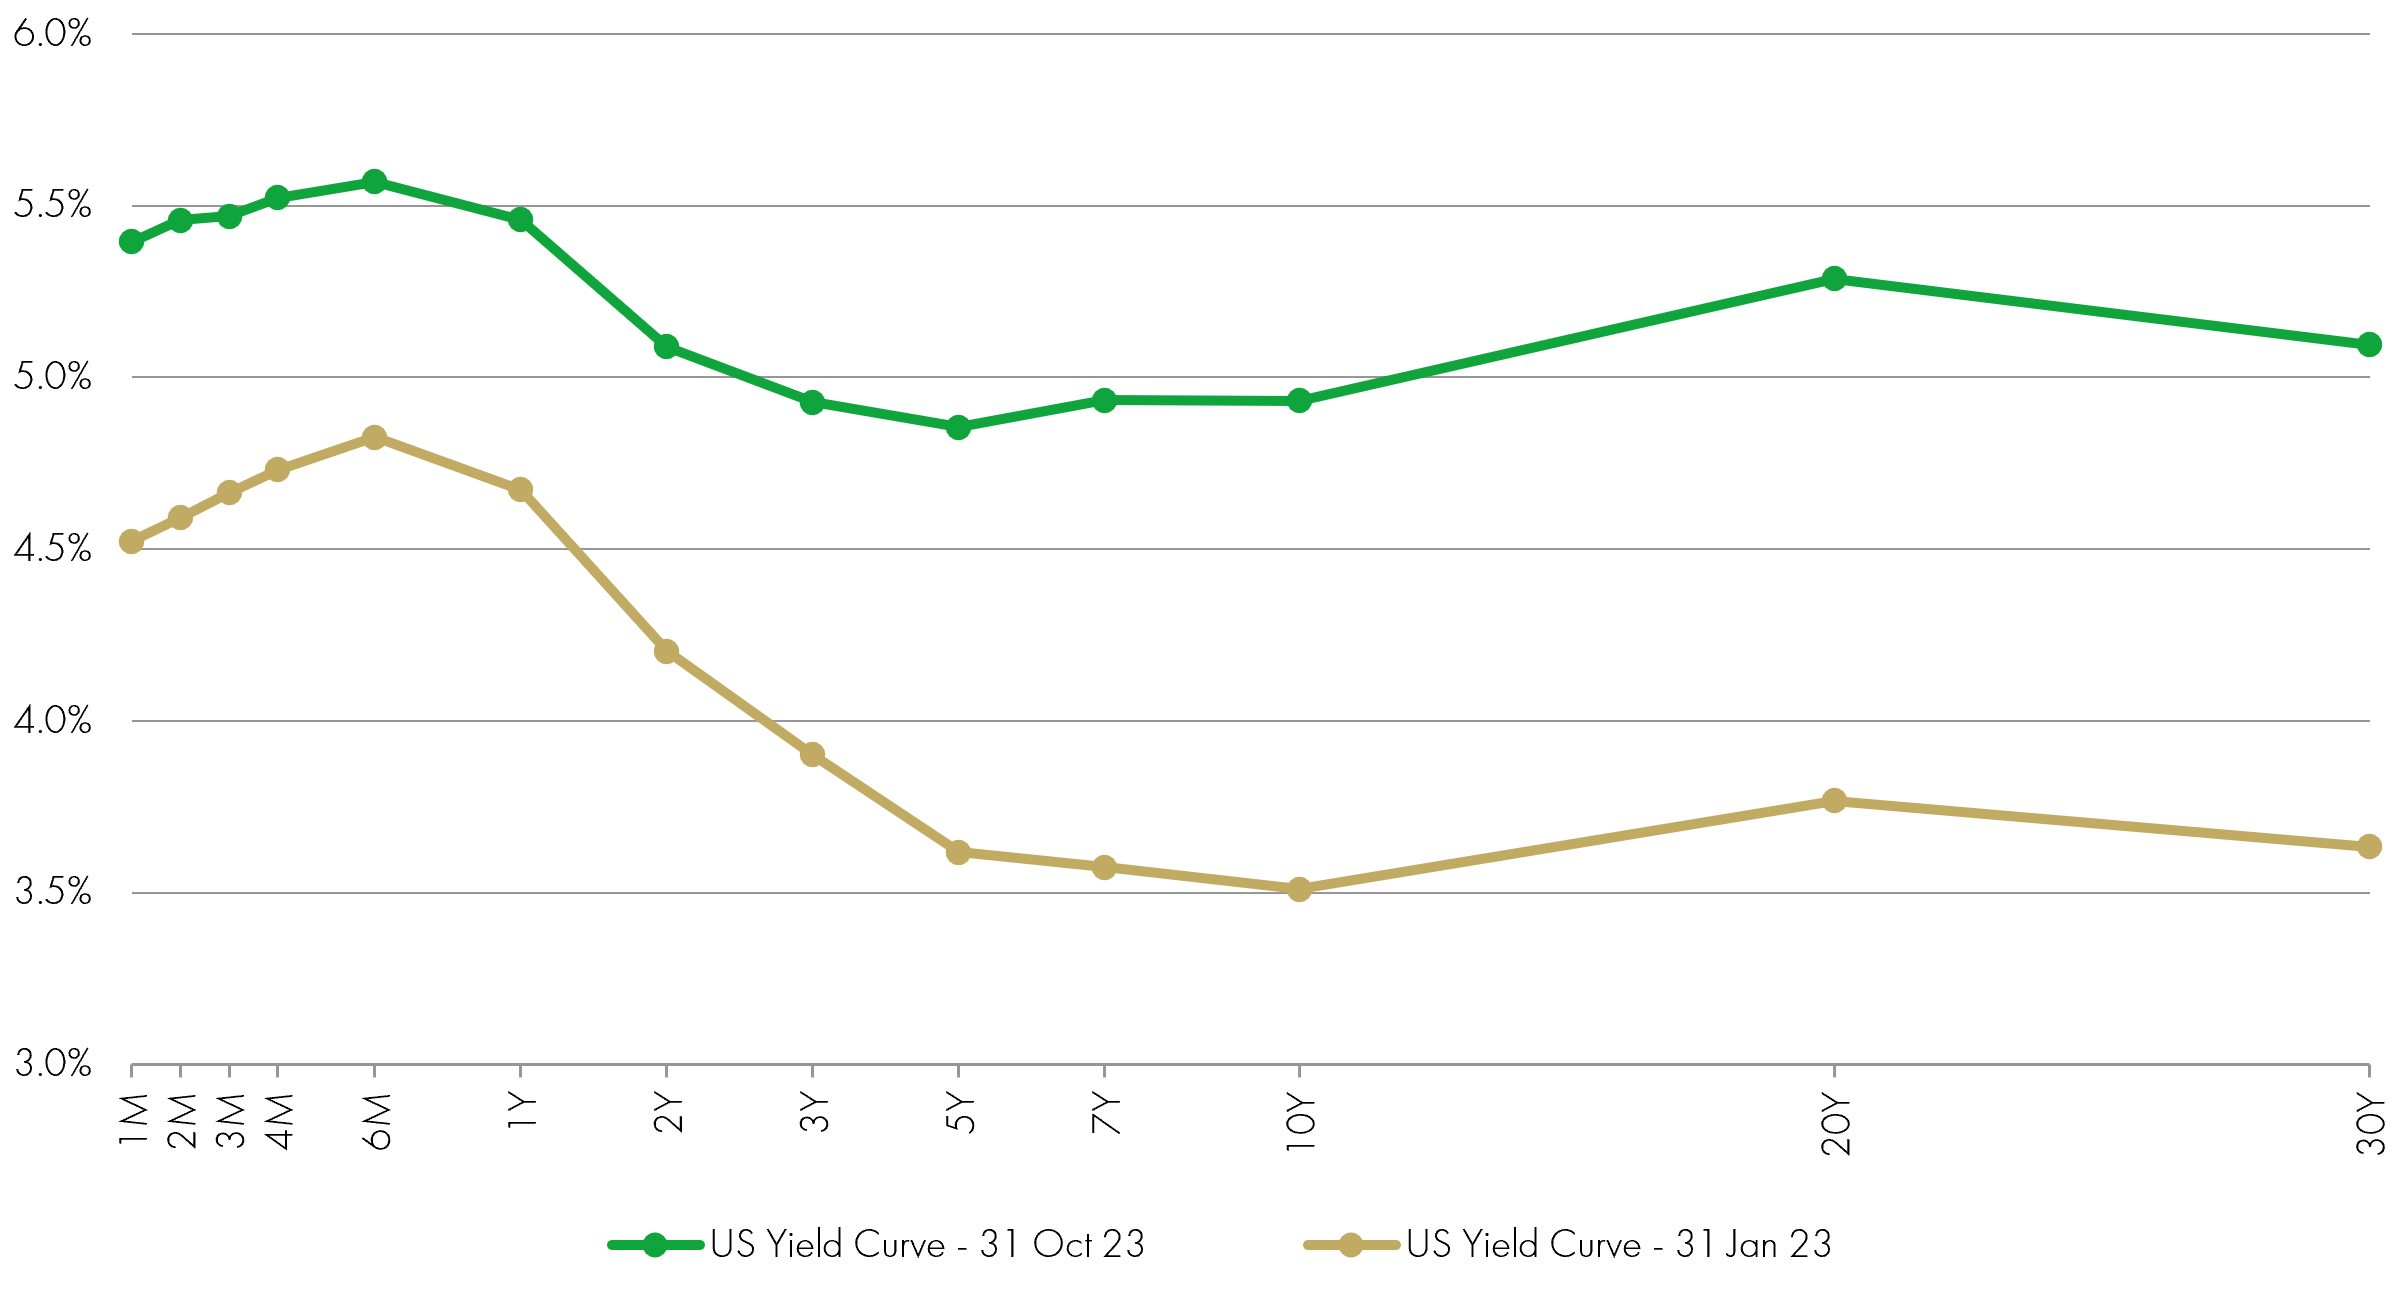
Source: Bloomberg, Liontrust, December 2023
(3) The bond yield curve also inverts, a warning sign for recession
The US yield curve had also ‘inverted’, meaning short-dated bonds offered greater yields than longer-dated bonds. For a variety of reasons, this curve is normally upward sloping, with higher yields offered by longer-dated bonds. When the yield curve is inverted, it is often seen as a recession indicator because one of the key determinants of yield curve shape is central bank interest rates; an inverted curve suggests interest rates are forecast to get lower, with the implication that central bank rate cuts would stem from weakening economic conditions.
While investors had priced in rising interest rates this year to combat rampant inflation, they expected this to push economies into recession and prompt sharp cuts further down the line.
The chart below shows the level of yield curve inversion over time, through the difference between the two-year yield and the ten-year yield. While the link with subsequent recession has proven a useful rule of thumb, its predictive power is by no means perfect – the relationship has notoriously predicted ‘nine out of the last six’ recessions, as shown below. Will the US economy slip into recession in 2024 following 2023’s yield curve inversion, or will its predictive success rate worsen to ten out of six?
US 2s10s curves and recessions
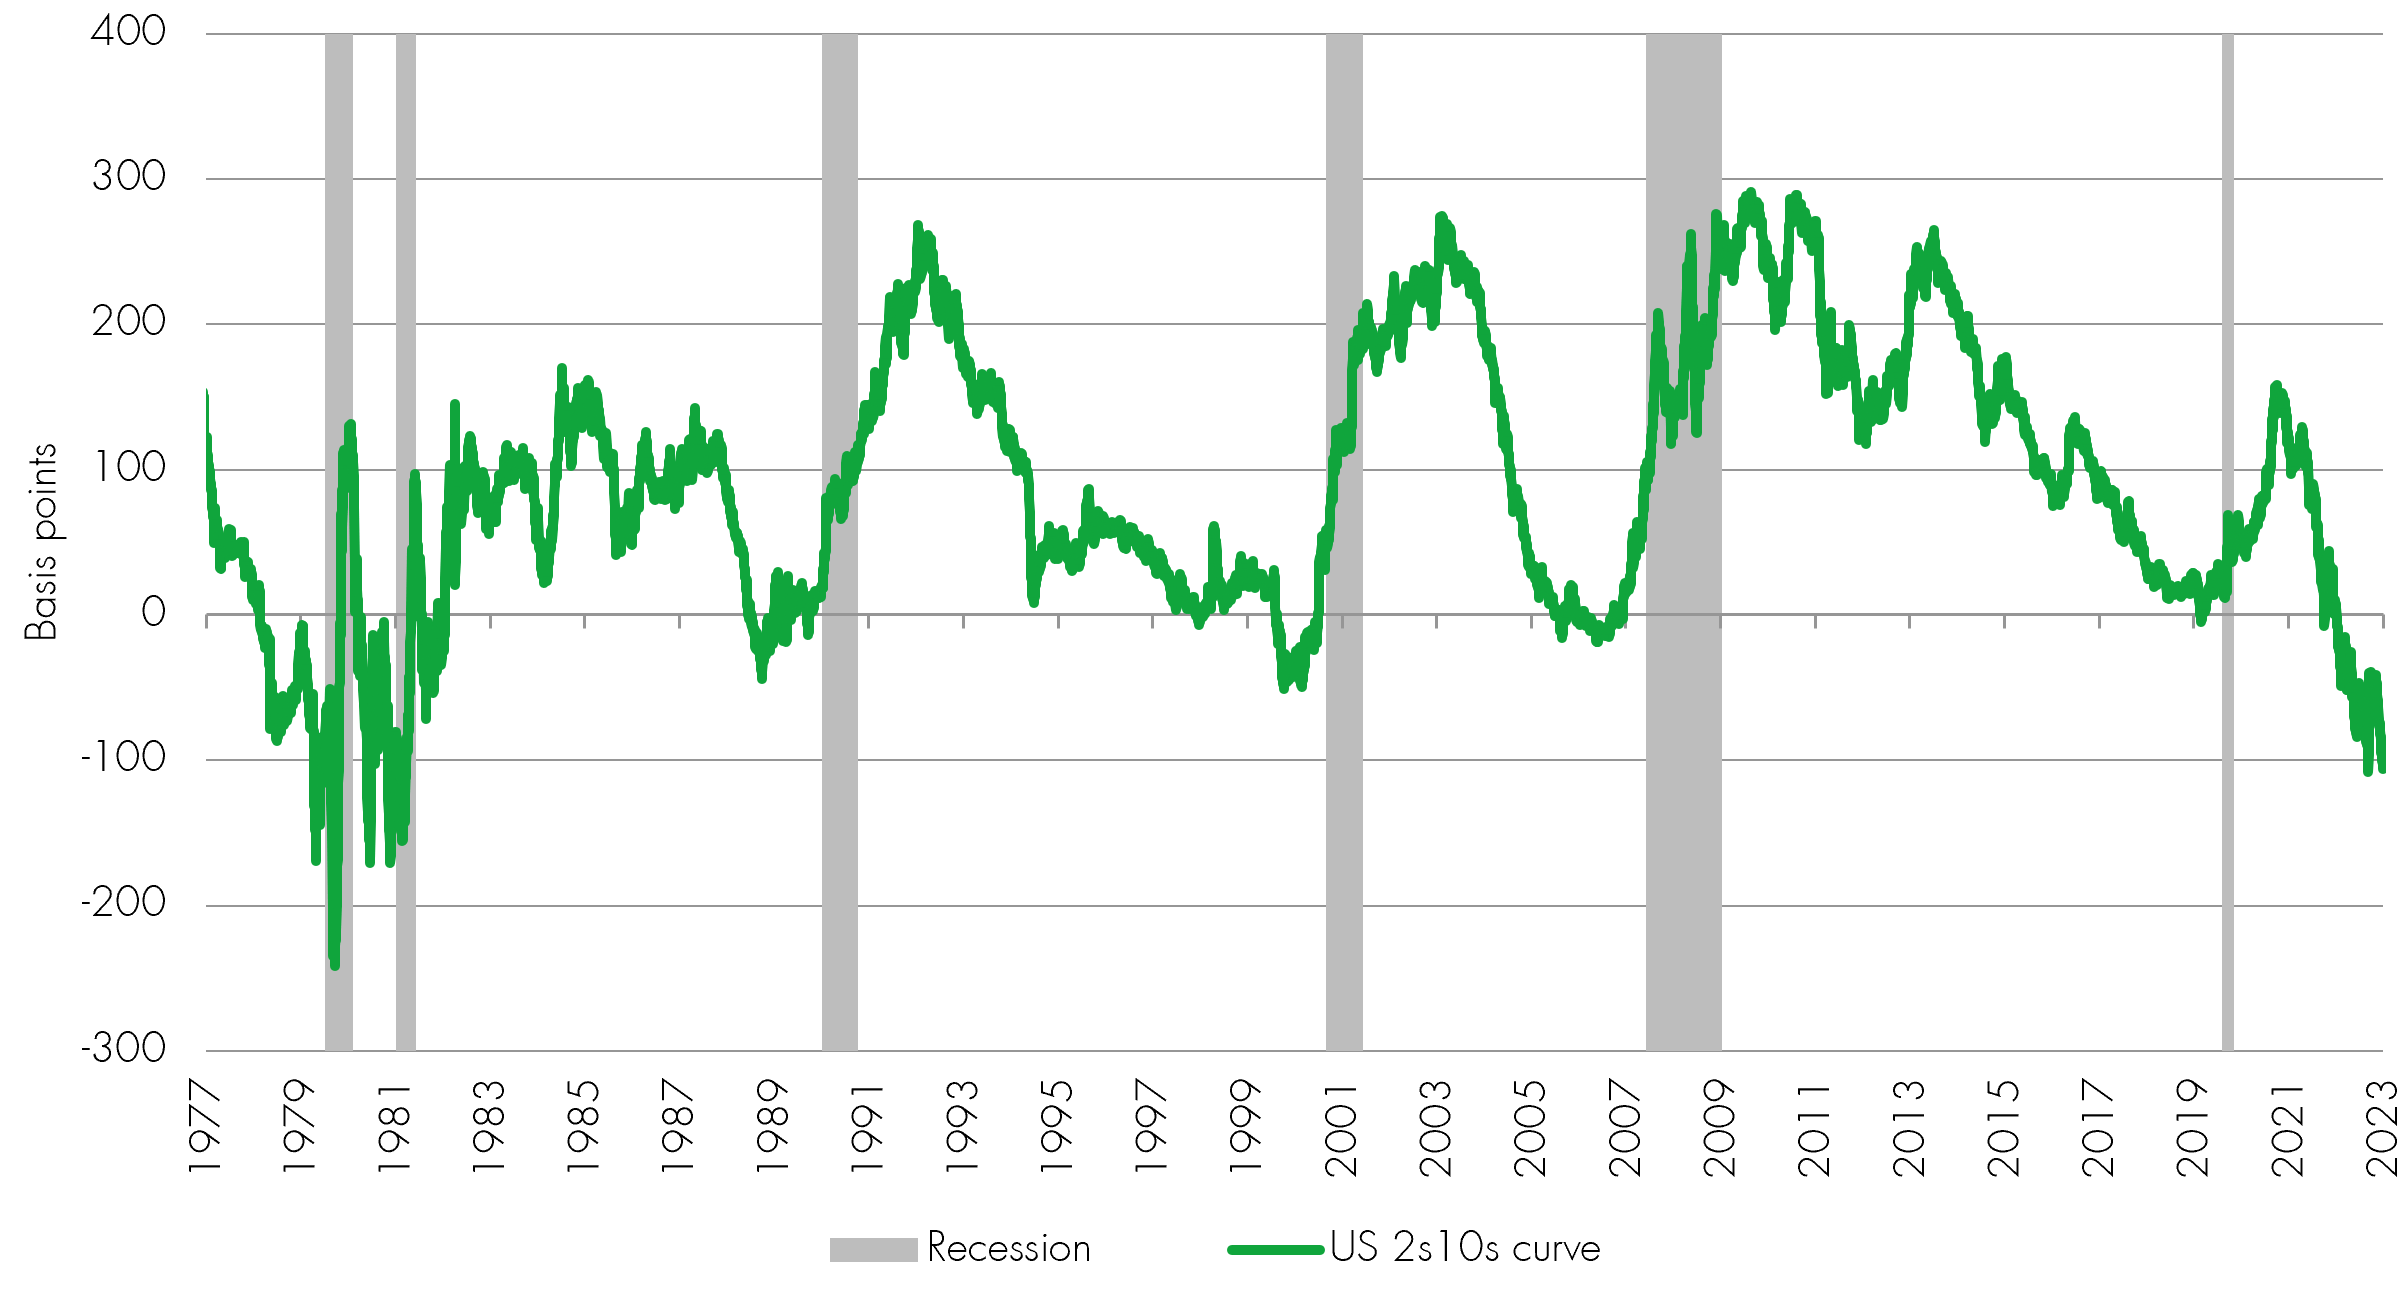
Source: Bloomberg, as at 30.06.23
(4) Bond market volatility contributed to a banking sector ‘mini-crisis’
One side effect of an inverted yield curve was that bank depositors began to shop around, encouraged by the relatively high level of short-term interest rates available in bond and money markets when compared with more meagre rates on banking accounts. This risk of deposit flight was one of the key factors in a mini-crisis suffered by the banking sector in March, following the collapse of Silicon Valley Bank.
With deposits being withdrawn, some banks were forced to liquidate bond portfolios, crystalising paper losses incurred after bond yields rose and prices fell, leaving these banks’ solvency in question. As institutions such as First Republic also went under, concerns grew that falling confidence could lead to a systemic problem for the banking sector. Banks responded by being more cautious in their lending decisions with a view to getting loan books and balance sheets looking lean and healthy. The chart below of Bloomberg’s US Financial Conditions Index shows a sharp drop – or tightening of lending standards in March – to levels not seen since the global financial crisis in 2008.
Bloomberg US Financial Conditions Index
Source: Bloomberg, Liontrust, December 2023
(5) Equity markets bounced back swiftly and strongly from the banking crisis
At the time, it had been thought that this contraction in credit supplied by the banking system would significantly choke economic activity, thereby helping central banks in their task of tackling inflation and reducing the number of interest rate hikes needed.
However, the banking crisis was contained without becoming systemic and equity markets swiftly rebounded to build on their strong start to the year. US stocks were leading the charge, fuelled by a remarkable performance from a group of mega-caps dubbed the Magnificent Seven. Nvidia, Microsoft, Apple, Amazon, Tesla, Alphabet and Meta Platforms have grown to account for almost a third of the S&P500’s value and between them powered 75% of the index’s 16% rise in the first half of 2023 as they notched up returns ranging from 36% to 189%.
S&P 500 top 10 stock contributors in first half of 2023
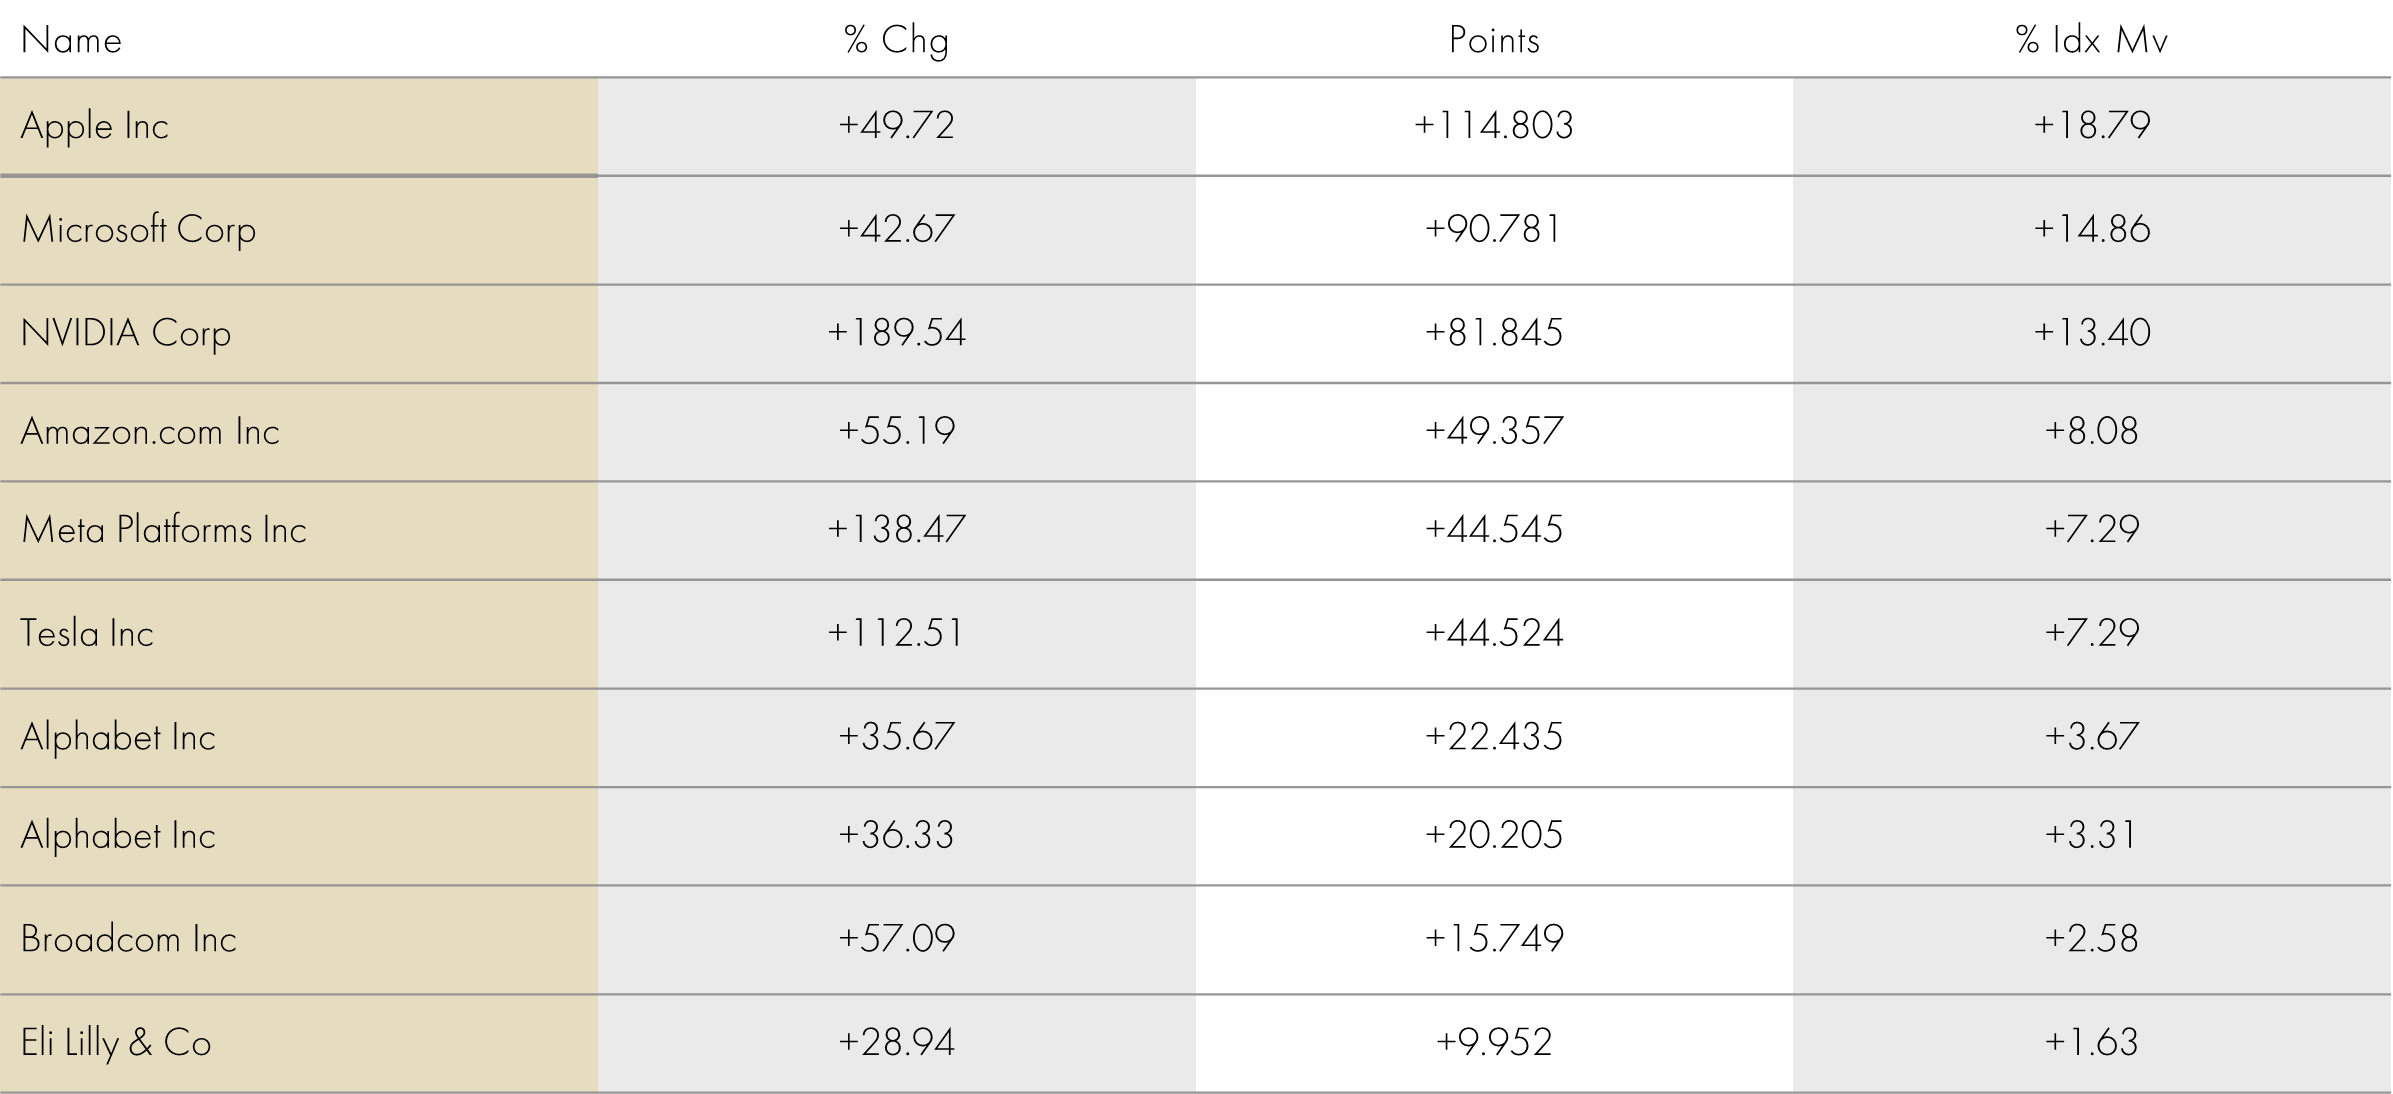
Source: Bloomberg, December 2023
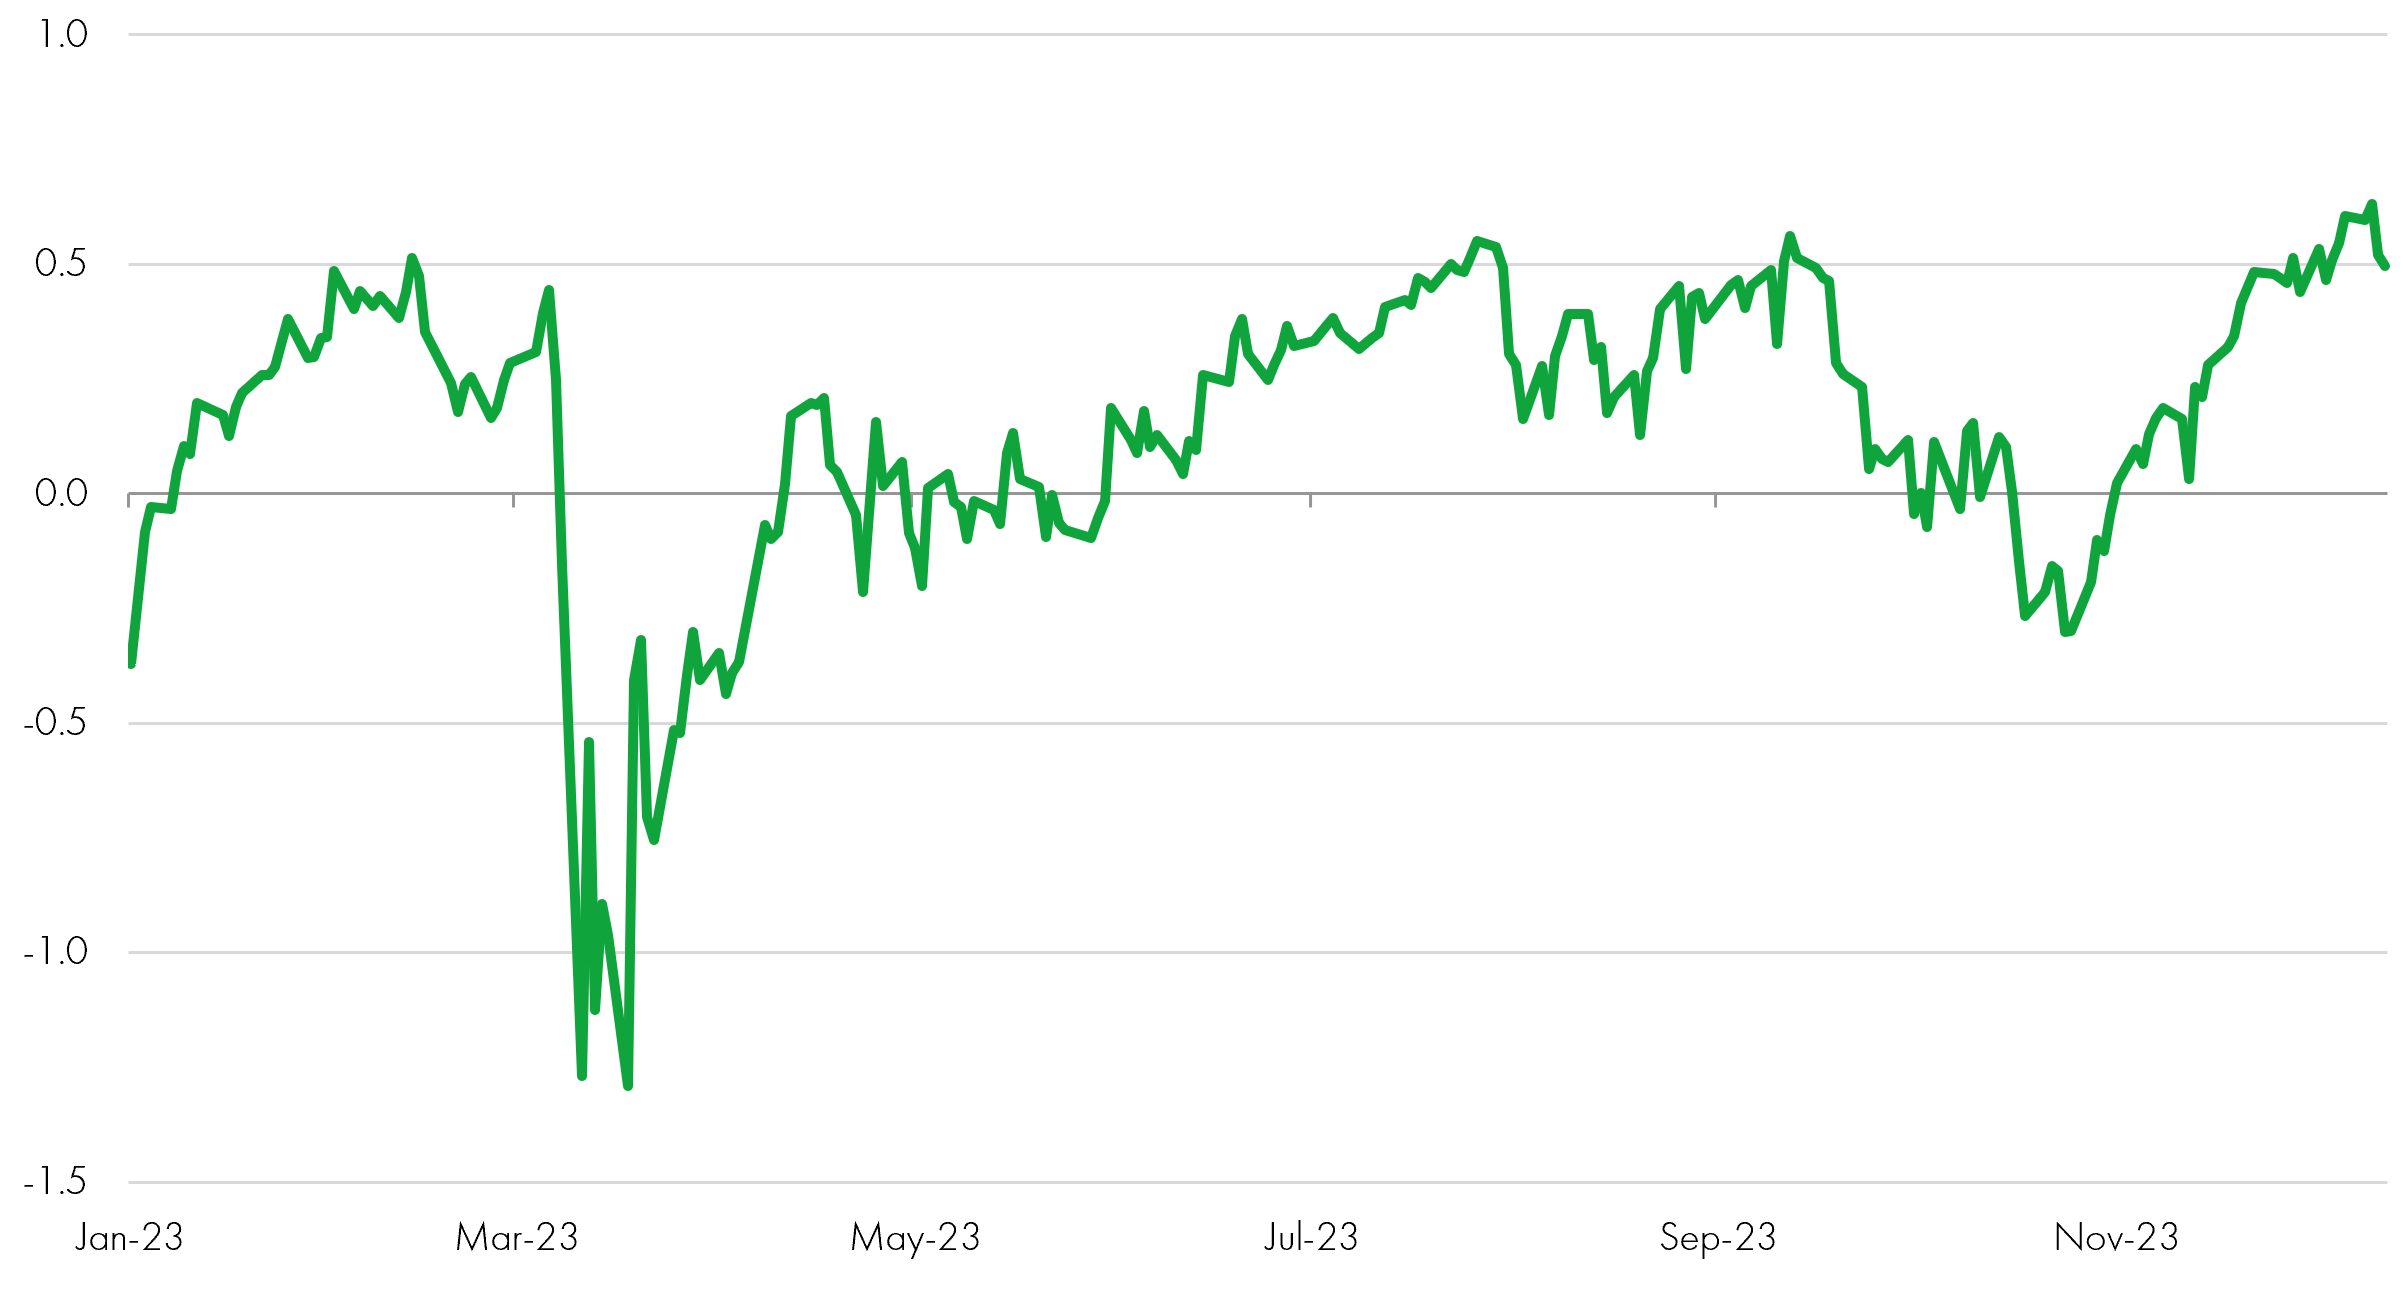
(6) Meanwhile, inflation finally started to meaningfully slow down
Having initially labelled post-pandemic inflation as a ‘transitory’ effect stemming from supply chain bottlenecks, central banks belatedly realised in 2022 that these price rises were becoming embedded in the economic system and likely to prove a more persistent problem. Their better-late-than-never attempt to return inflation to acceptable levels started to feed through in data during the second half of 2023.
UK consumer price inflation
Source: Bloomberg, December 2023
(7) Despite a pause in central banks’ rate hikes, investors adjust to ‘higher for longer’
After consecutive rate hike streaks of 14 and 10 respectively for the Bank of England and the US Federal Reserve, both central banks opted to pause their tightening cycles in September. Although the cumulative impact of restrictive monetary policy was bringing inflation down towards target, the message from central bankers was that higher rates would need to be maintained for some time in order to finish the job. Having previously expected interest rates to be cut fairly swiftly after they reached their peak, investors adjusted to a new likelihood of “higher for longer” rates.
Central bank interest rates: US Federal Reserve, European Central Bank and Bank of England
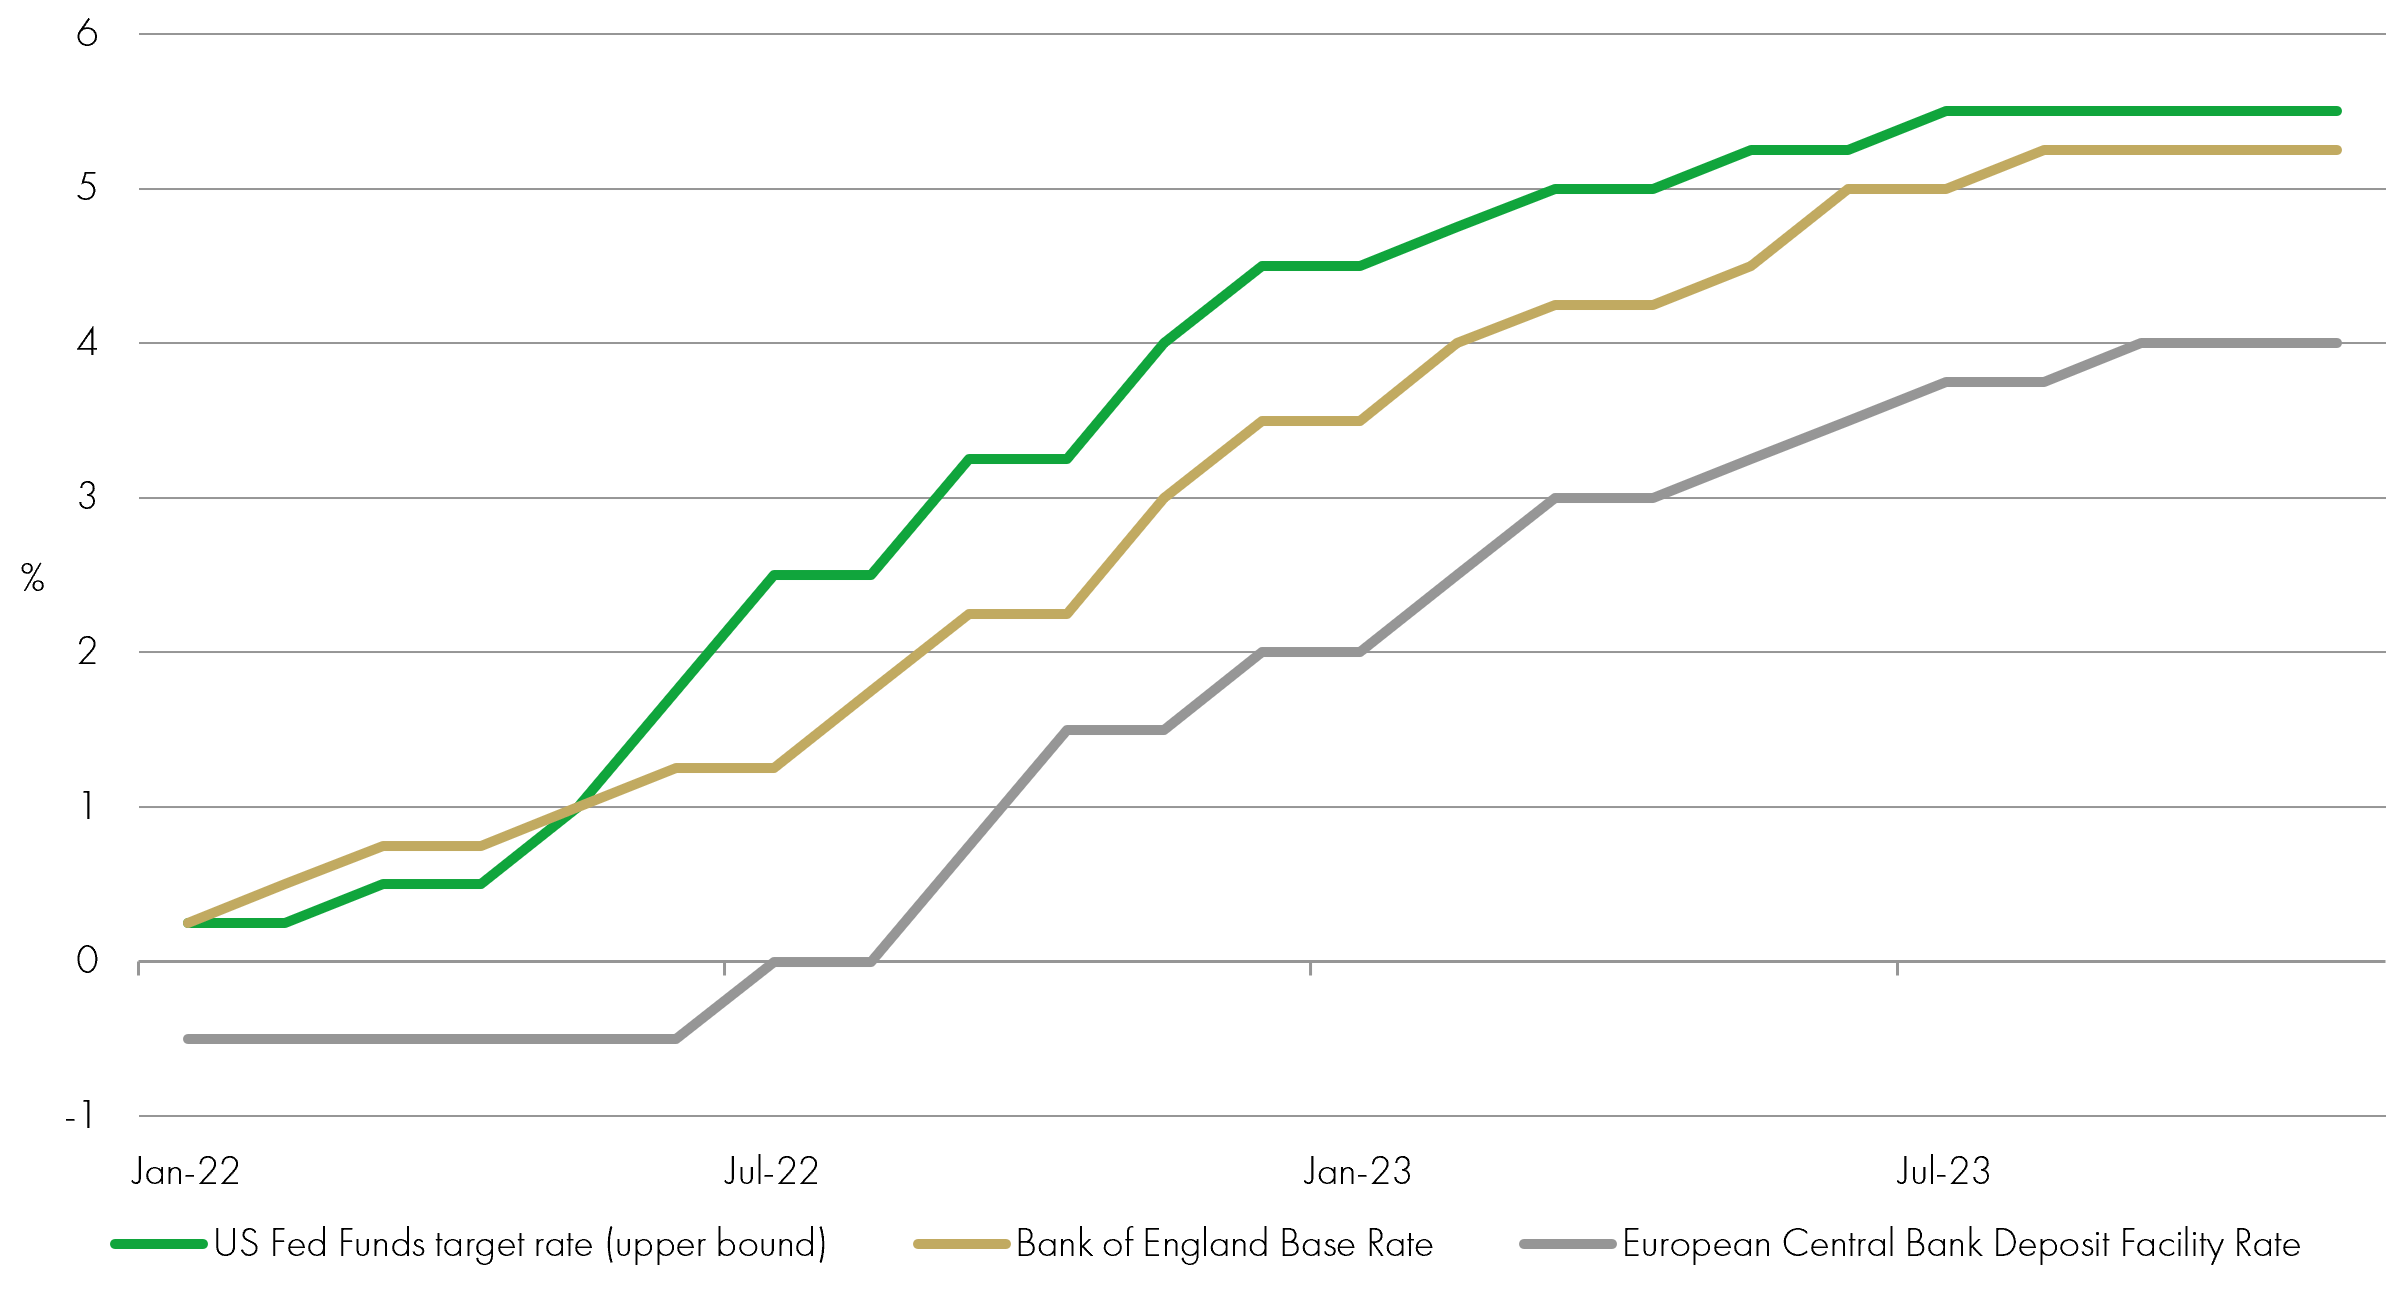
Source: Bloomberg, December 2023
(8) Investors shun the UK stock market, a trend which hit the smallest companies hardest
The emergence of country-specific factors – such as Brexit-related labour shortages – has led the UK economic growth outlook to lag that of other developed nations post-Covid, with inflation running higher. The IMF’s most recent outlook forecasts 2023 and 2024 growth of 0.5% and 0.6% respectively for the UK, below the advanced economies averages of 1.5% and 1.4% (including the US at 2.1% and 1.5%) and the global average of 3.0% and 2.9%.
This has coincided with a significant weakening in investor sentiment towards UK equities – accelerated by the much-improved yields available on cash and bonds – which has been reflected on the UK stock market by a significant size bias to returns. The typically more internationally diversified FTSE 100 large-cap index rose 1.6% in the first 10 months of 2023, outperforming the -6.8% return from the FTSE 250 Index, the -2.5% from the FTSE Small Cap (ex investment trust) and -17% from the FTSE AIM All Share Index. Since the start of 2022, the FTSE 100 Index has now outperformed the FTSE 250 by 29 percentage points.
UK stock market performance by size group
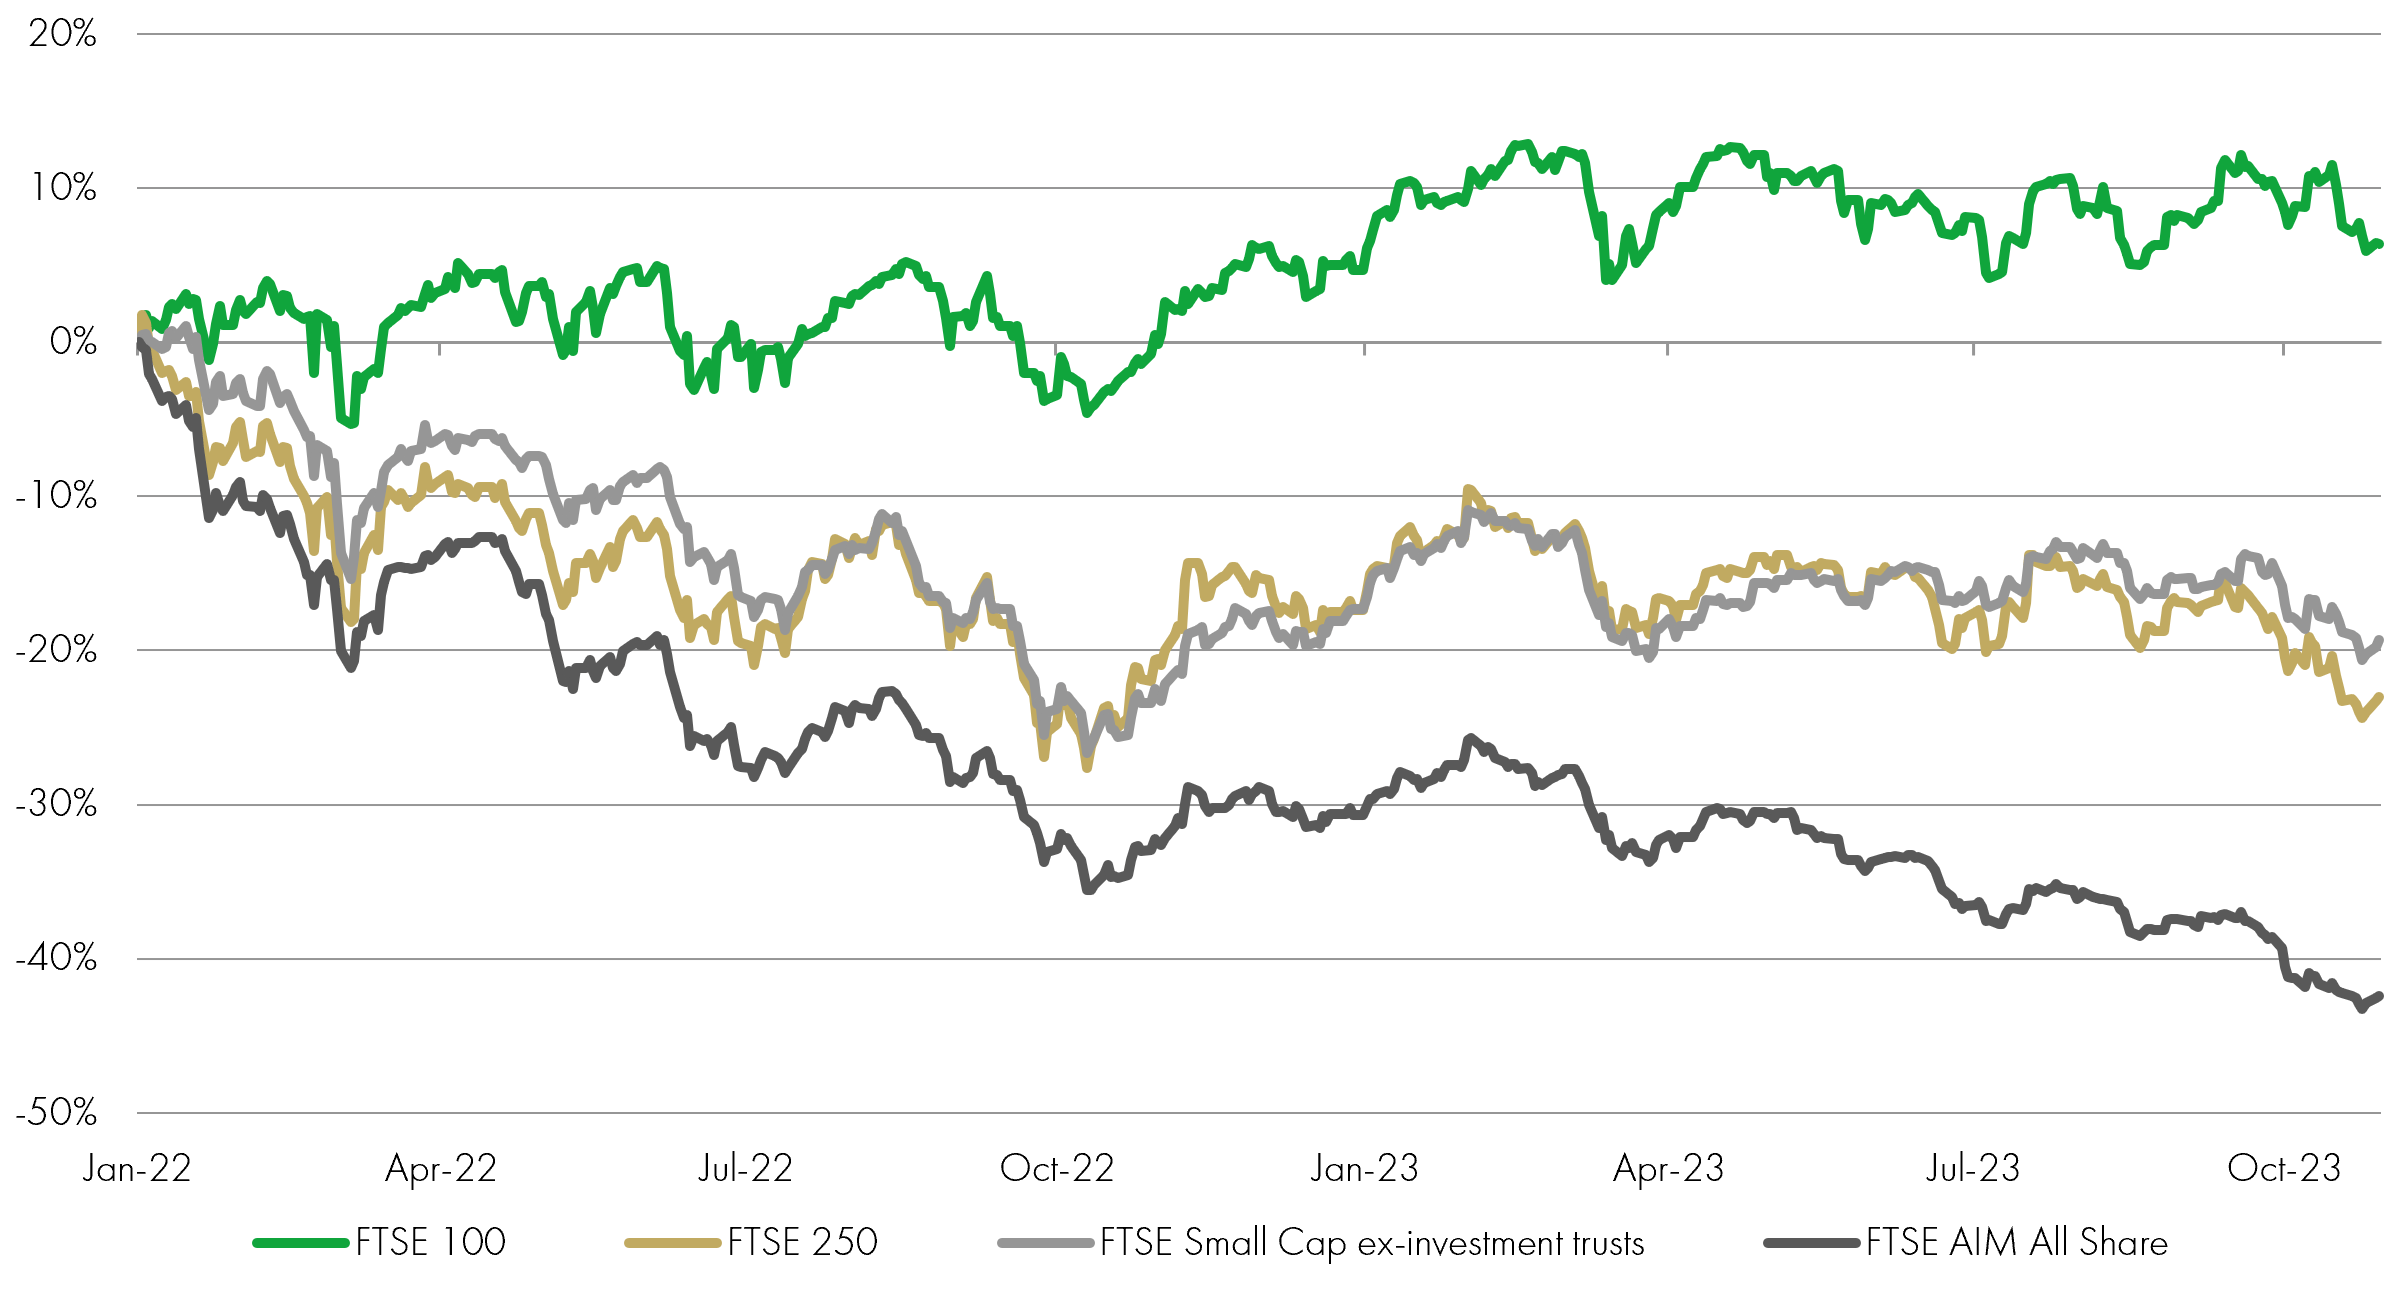
Source: Bloomberg, December 2023
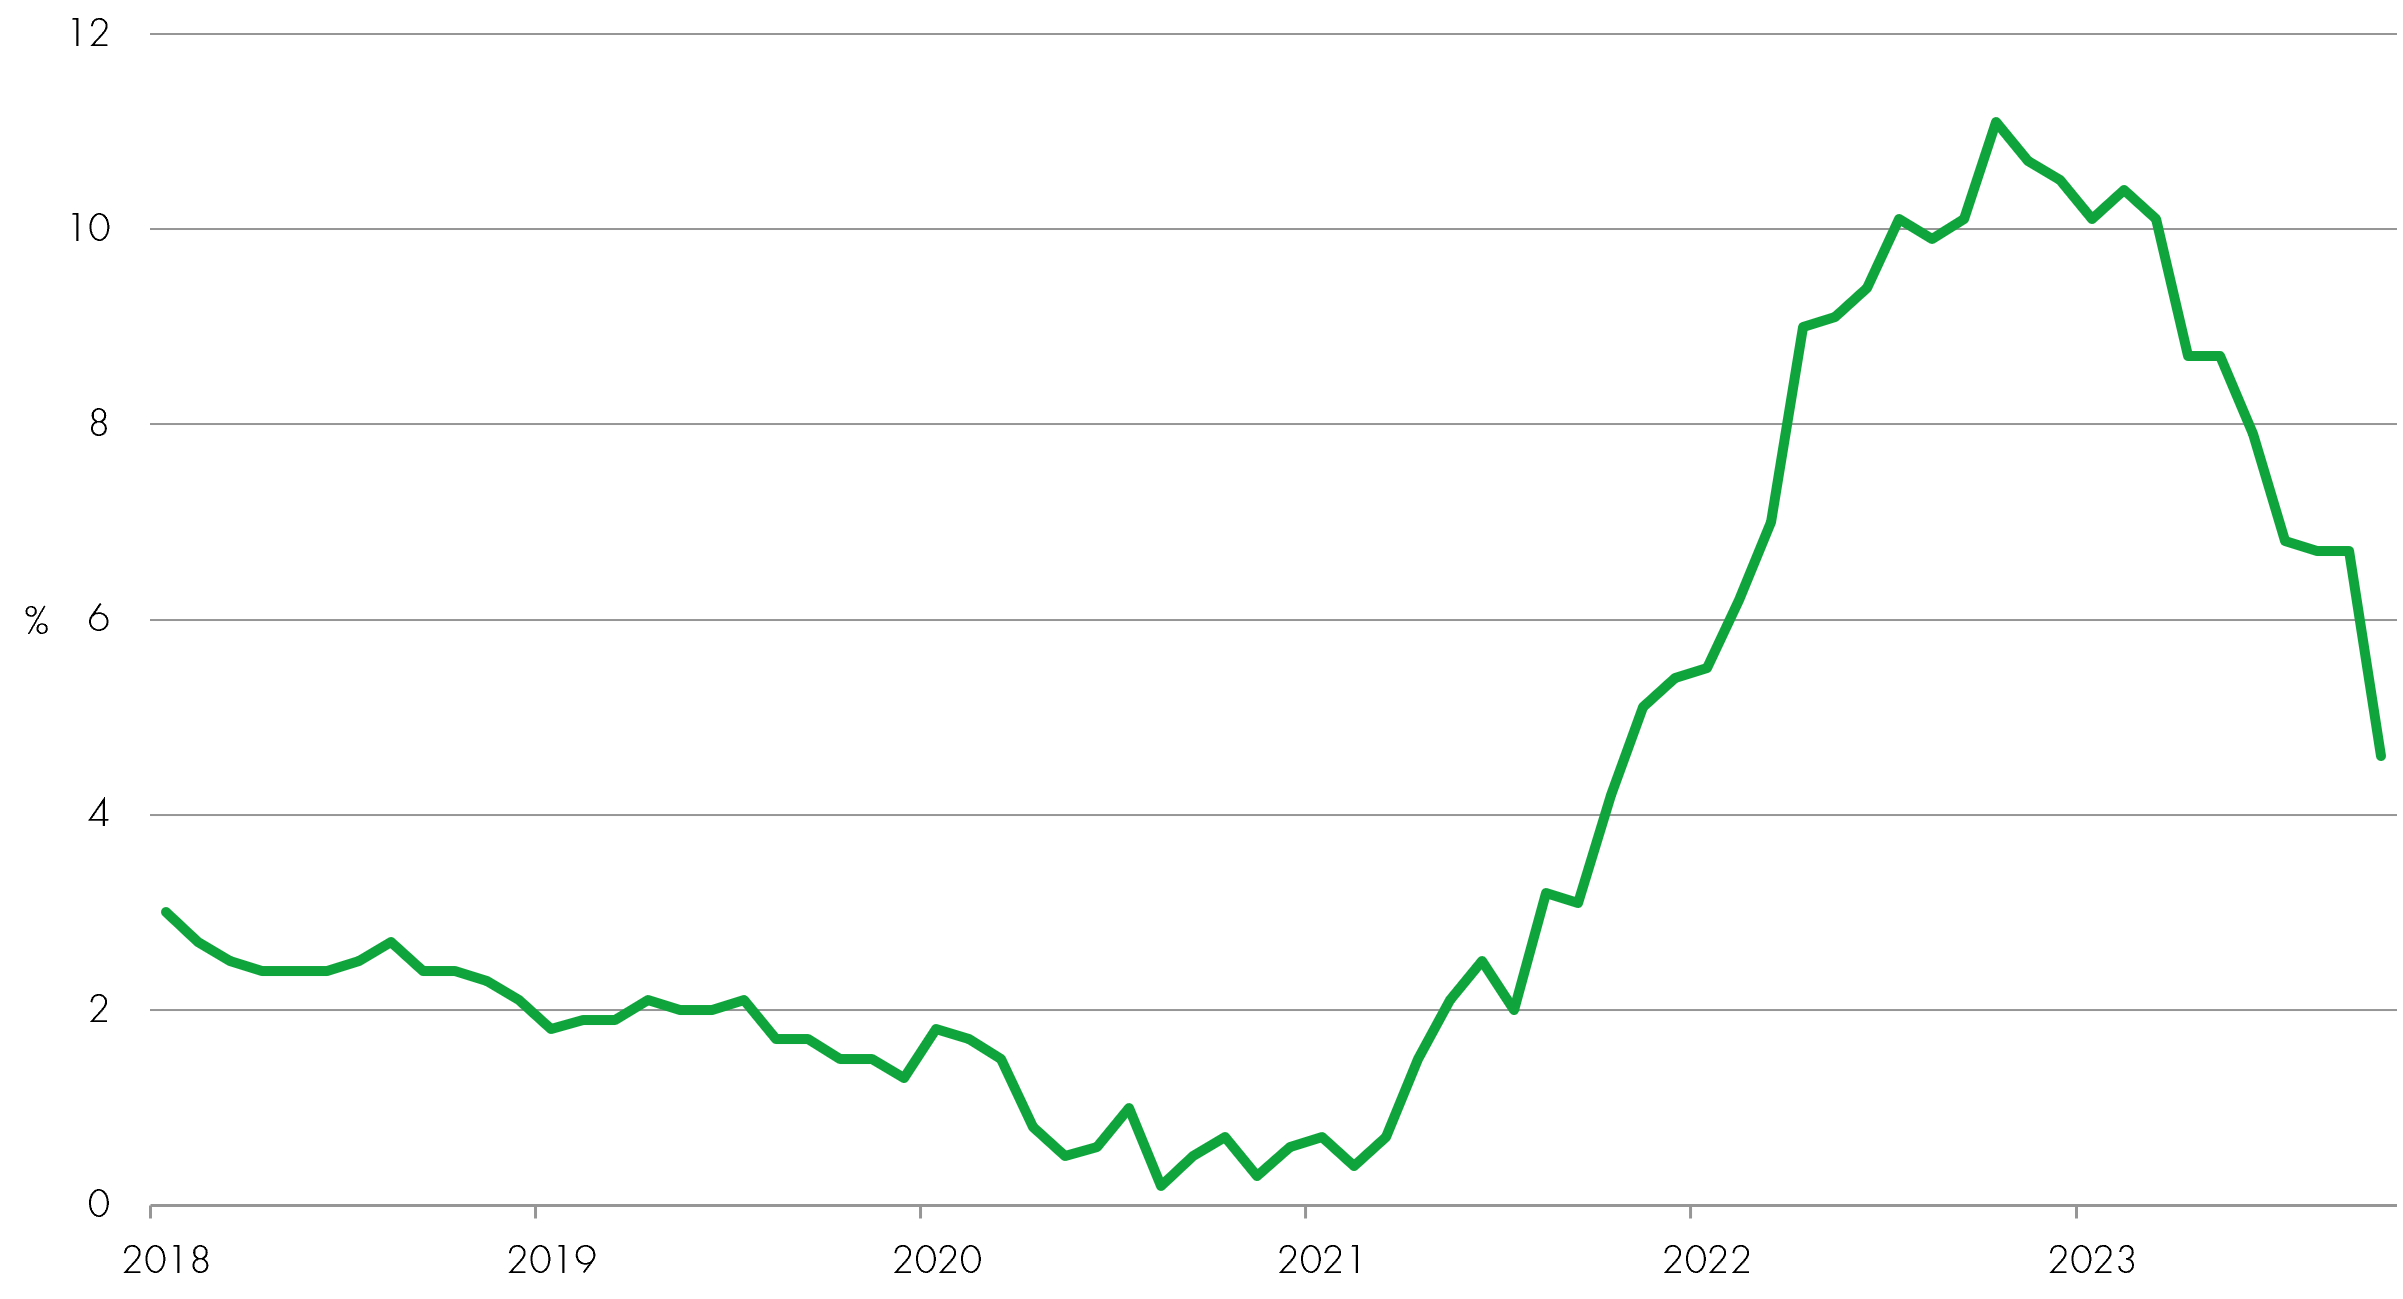
(9) High interest rates and decelerating inflation means positive real yields
With inflation belatedly heading in the right direction but interest rates still held at high levels until inflation is closer to the Bank of England’s 2% target, the UK’s real interest rate turned positive for the first time in seven years. The real interest rate adjusts for the impact of inflation by subtracting it from the nominal base rate. The fall in UK headline inflation from 6.7% in September to 4.6% in October meant it was lower than the Bank of England’s 5.25% base rate. Many savings accounts still offer interest below the base rate, however.
UK inflation, base rates and real interest rates
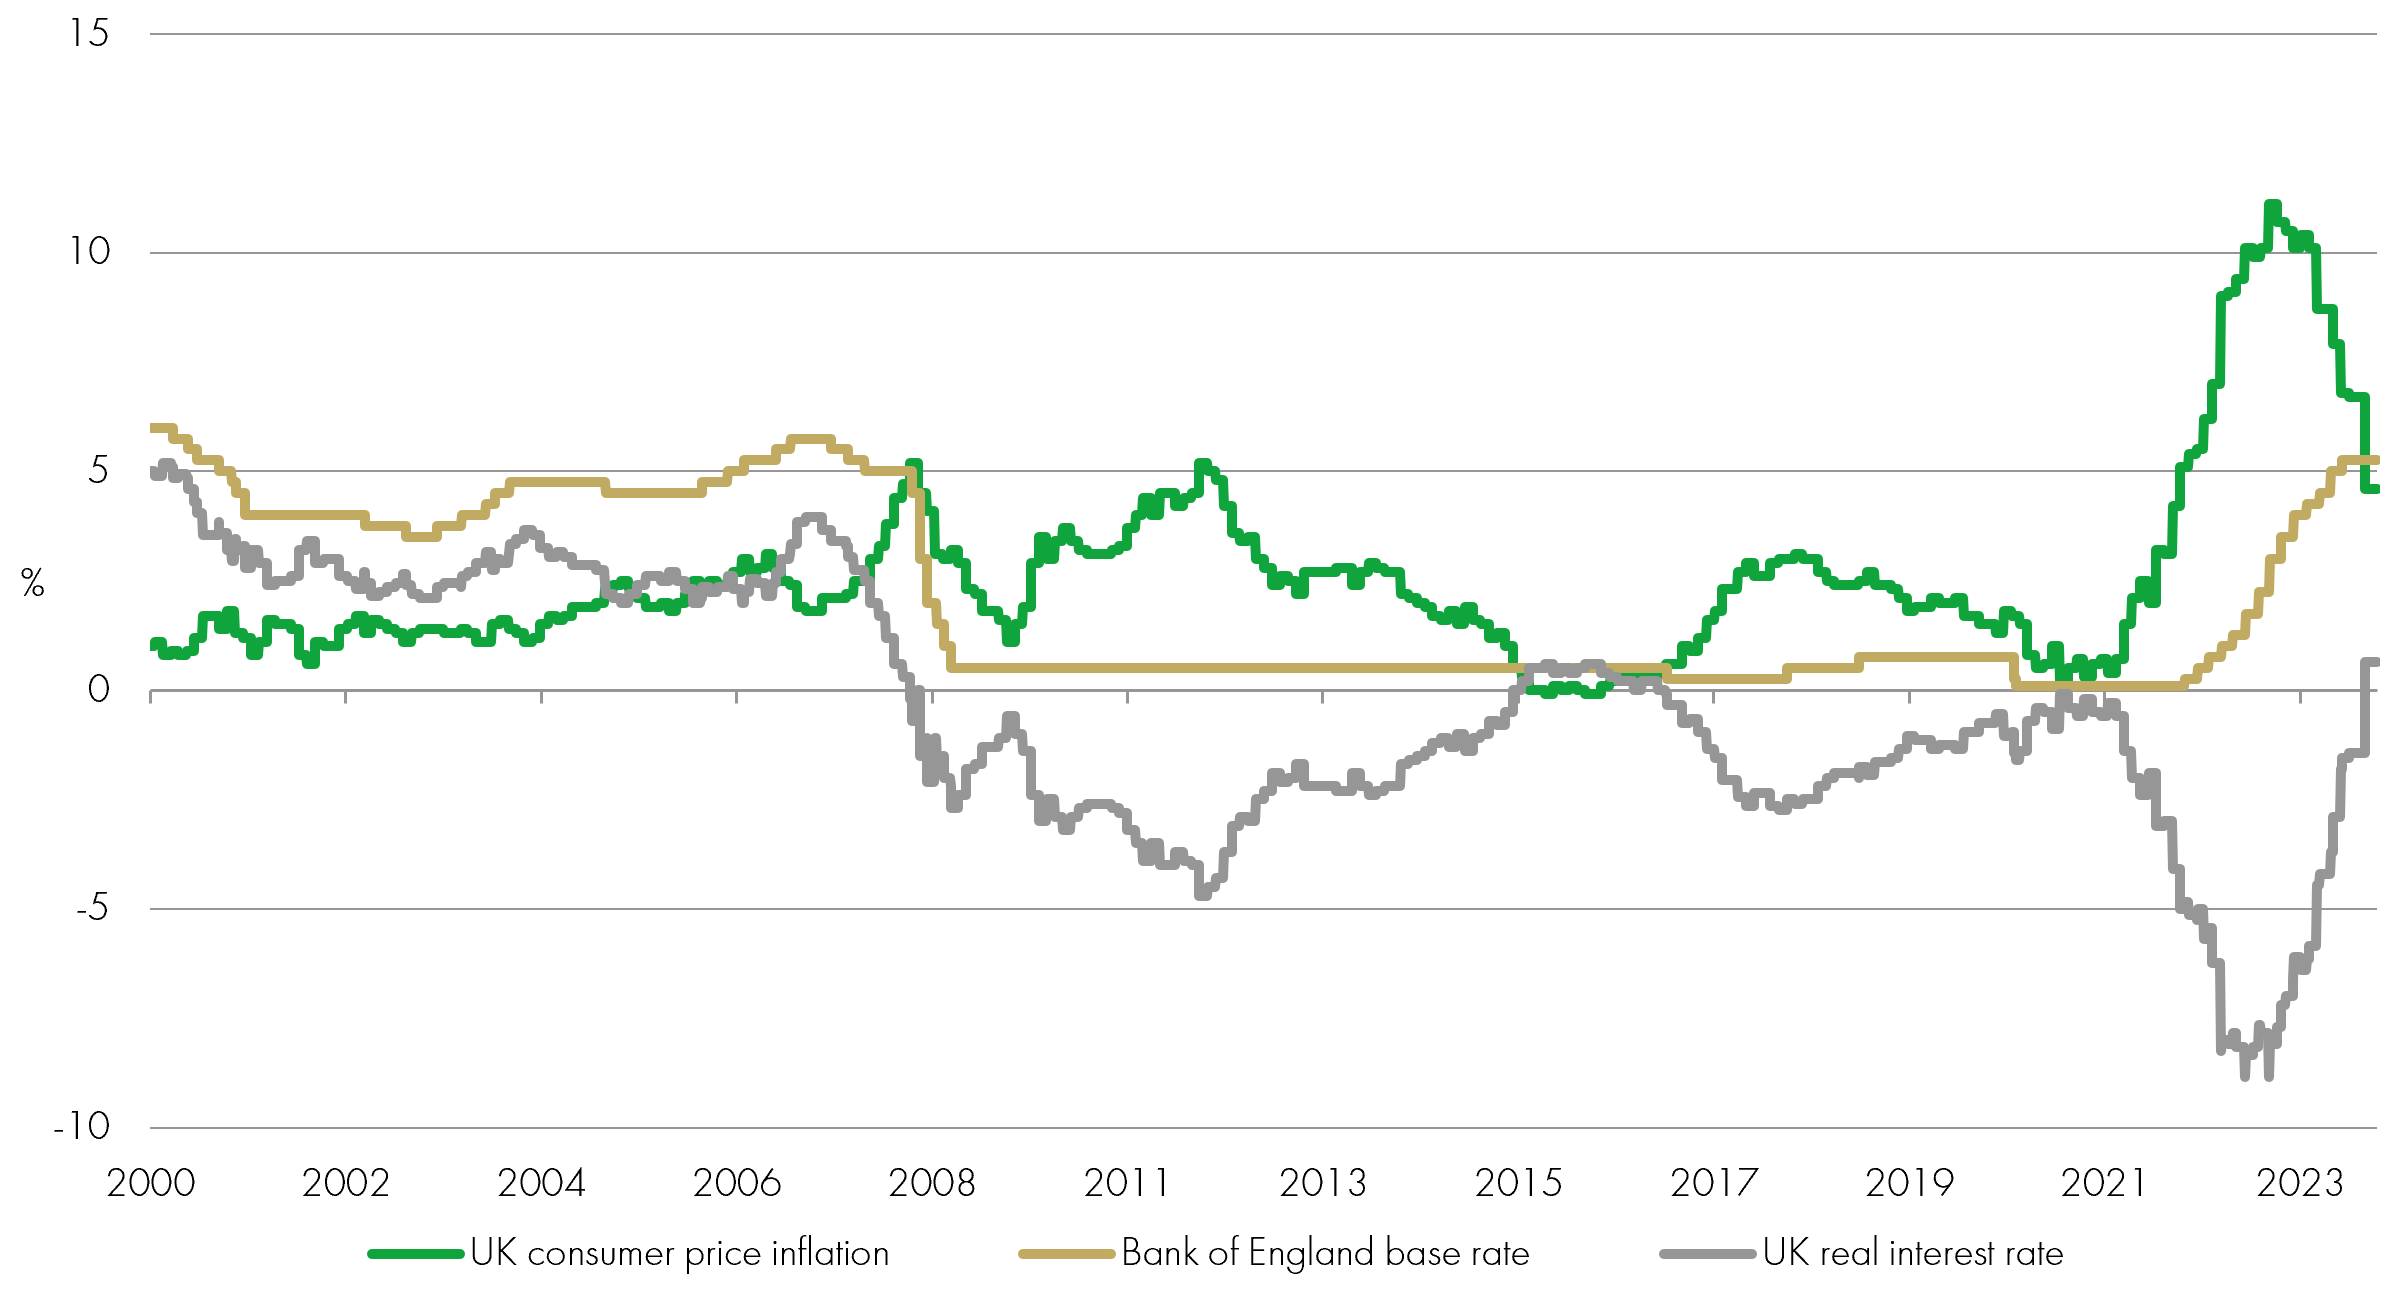
Source: Liontrust, December 2023
10) Finishing the year as we’d planned to start it – with pivot hopes
Lower inflation readings towards the end of the year raised hopes that central banks would be able to cut interest rates sooner than they had been indicating. Importantly, this could help support the much-discussed ‘soft landing’ for economies, side-stepping the feared scenario in which inflation-fighting policies from central banks prompts a recession.
US Federal Reserve Chair Jay Powell then gave markets an early Christmas present, commenting after the central bank’s December meeting that it was at the peak of its tightening cycle, with three 25 basis point cuts forecast. Financial markets immediately moved to price in an even more bullish scenario – 7 cuts in 2024.
US interest rate expectations at the end of 2023 (14th December)
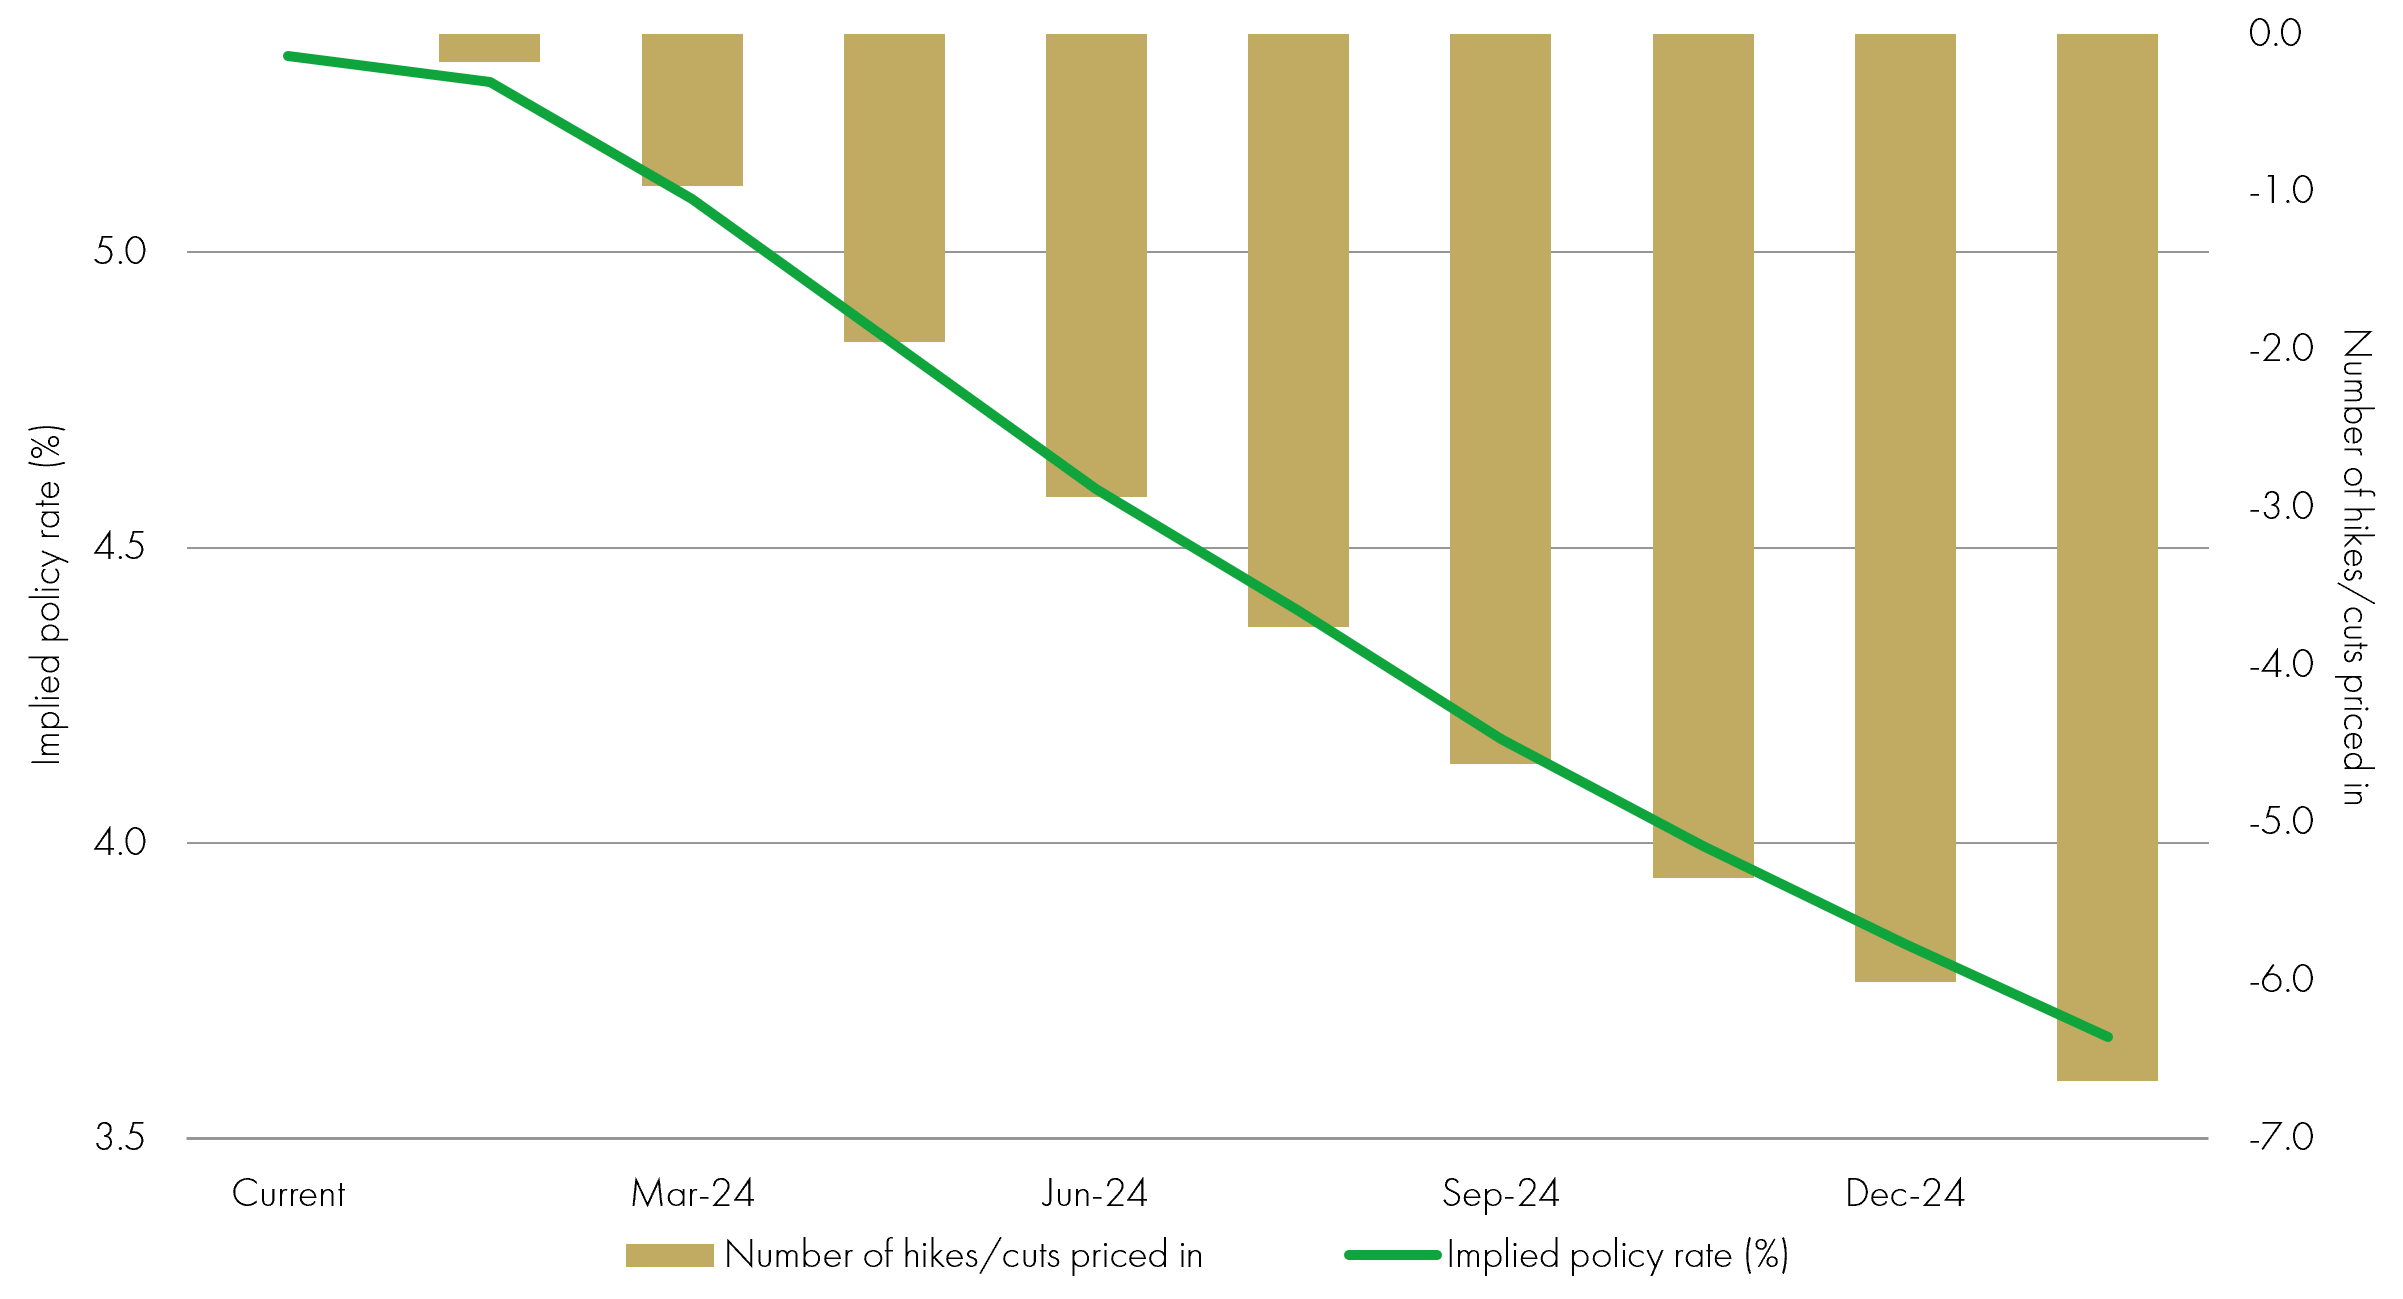
Source: Bloomberg, December 2023
KEY RISKS
Past performance is not a guide to future performance. The value of an investment and the income generated from it can fall as well as rise and is not guaranteed. You may get back less than you originally invested.
The issue of units/shares in Liontrust Funds may be subject to an initial charge, which will have an impact on the realisable value of the investment, particularly in the short term. Investments should always be considered as long term.
DISCLAIMER
This is a marketing communication. Before making an investment, you should read the relevant Prospectus and the Key Investor Information Document (KIID), which provide full product details including investment charges and risks. These documents can be obtained, free of charge, from www.liontrust.co.uk or direct from Liontrust. Always research your own investments. If you are not a professional investor please consult a regulated financial adviser regarding the suitability of such an investment for you and your personal circumstances.
This should not be construed as advice for investment in any product or security mentioned, an offer to buy or sell units/shares of Funds mentioned, or a solicitation to purchase securities in any company or investment product. Examples of stocks are provided for general information only to demonstrate our investment philosophy. The investment being promoted is for units in a fund, not directly in the underlying assets. It contains information and analysis that is believed to be accurate at the time of publication, but is subject to change without notice. Whilst care has been taken in compiling the content of this document, no representation or warranty, express or implied, is made by Liontrust as to its accuracy or completeness, including for external sources (which may have been used) which have not been verified. It should not be copied, forwarded, reproduced, divulged or otherwise distributed in any form whether by way of fax, email, oral or otherwise, in whole or in part without the express and prior written consent of Liontrust.