This year marks the tenth anniversary of two of the most significant enhancements to the Cashflow Solution investment process – the 2014 introduction of Secondary Scores and Market Regime Indicators.
Cashflow Champions: A stable core since the inception of the investment process
Our investment process, the Cashflow Solution, was established in 2006 based on the core belief that cash flow is the single most important determinant of shareholder returns.
The basic idea is that companies run by conservative managers focused on and delivering cash flow perform significantly better than companies run by aggressive company managers making large cash investments today to chase over-ambitious future growth targets.
We rank the universe of European stocks based on their cashflow attractions. The top 20% form our Cashflow Champions watchlist from which we choose investments for our portfolios following in-depth forensic analysis of balance sheets and cash flow statements.
Broadly speaking, this top 20% contains companies that are cheaper than the market with cash returns that are better than the market.
Evolution, not revolution
When we carried out an in depth review of our investment process over the course of 2013 – paying close attention to how it had historically been applied in practice – it became clear that we could make improvements that would improve both the scale and consistency of our returns.
The single most impactful change resulting from this research was the introduction in 2014 of ‘secondary scores’. This has proved essential in helping us refine down our Cashflow Champions list to the final selections for our portfolios. Interestingly, while we have carried out numerous research projects on the construction of our secondary scores since 2014, they remain largely unchanged since their introduction ten years ago.
As we briefly recapped in our outlook for European markets in 2024, we categorise companies’ cash flow profiles as possessing Momentum, Cash Return, Recovering Value or Contrarian Value appeal. We call these categories our secondary scores as they act as a further filter to our primary cash flow screen.
When we introduced our secondary scores to stock selection in 2014 we also introduced some indicators to guide us on stock selection in the context of the current market cycle. We call these our market regime indicators and they are unique to us. This combination of secondary scores and macro indicators has been essential in giving our cash flow investment process style flexibility and ensuring that portfolios are positioned to reflect prevailing market conditions.
Our market regime indicators guide us on both the outlook for markets and style positioning.
A flexible style approach
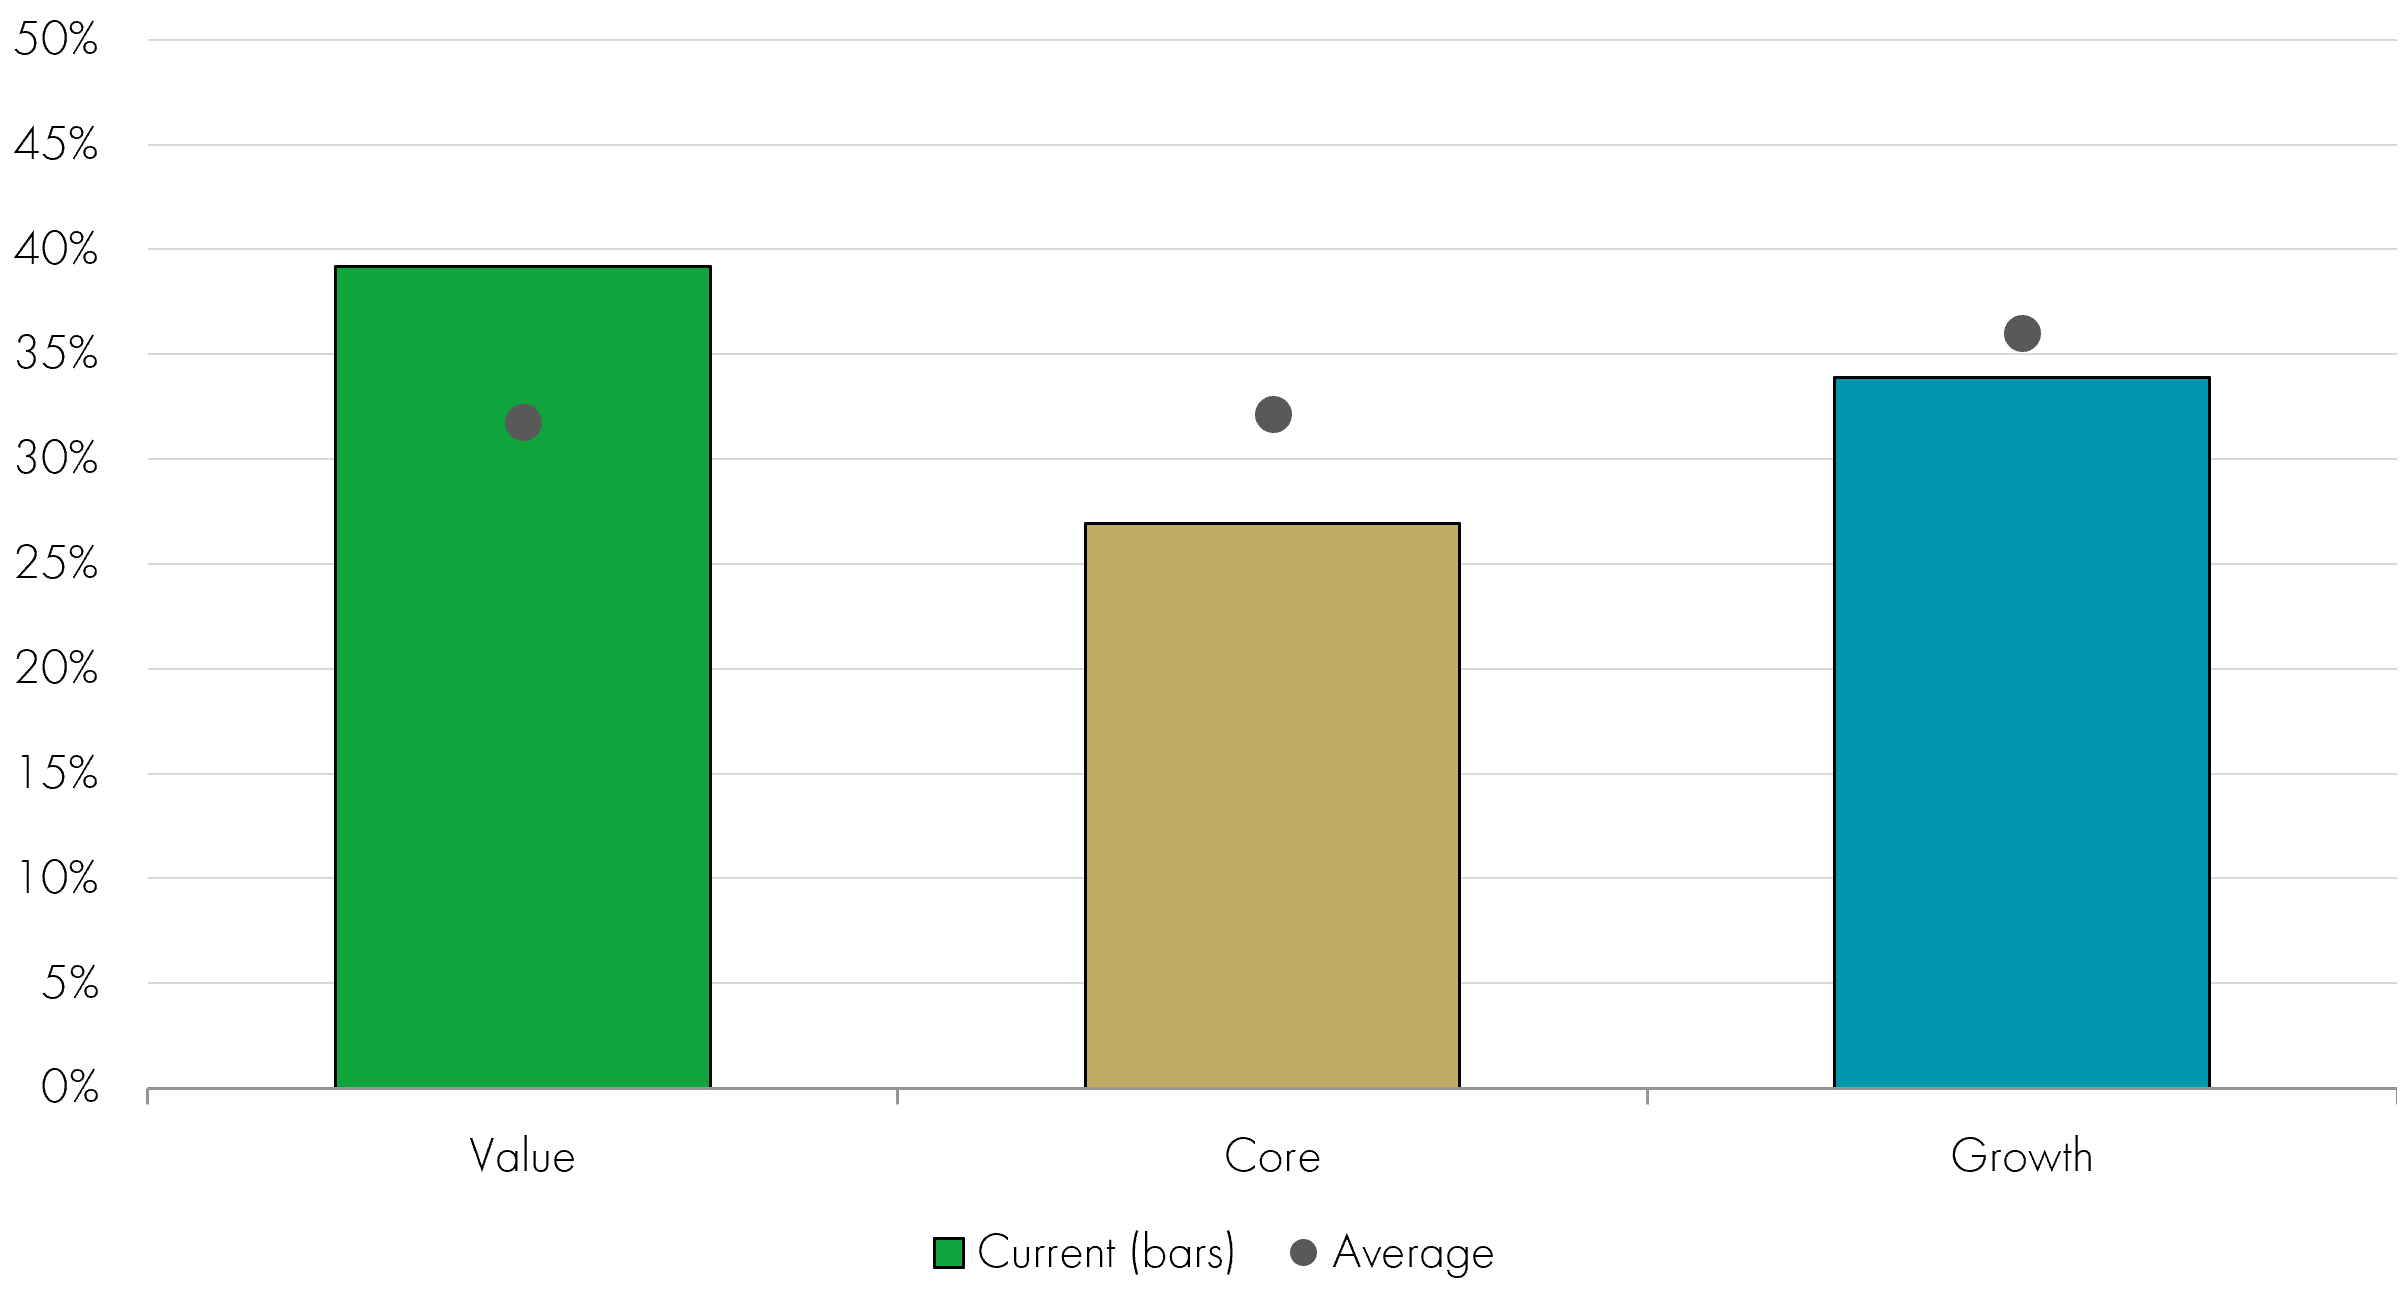
Using the Liontrust European Dynamic Fund as an example, we find that the average style exposure has been fairly balanced since the secondary scores were launched ten years ago. The three grey circles in the chart below illustrate the average portfolio exposure to three styles – Value, Core and Growth – as defined by data provider Morningstar. This shows a split that isn’t far from a third in each category on average. The solid bars show recent portfolio positioning as at 31 December 2023: broad style exposure with slight bias towards value style shares.
Liontrust European Dynamic Fund: performance during different market conditions

However, this balanced picture of the current positioning and average exposure over the
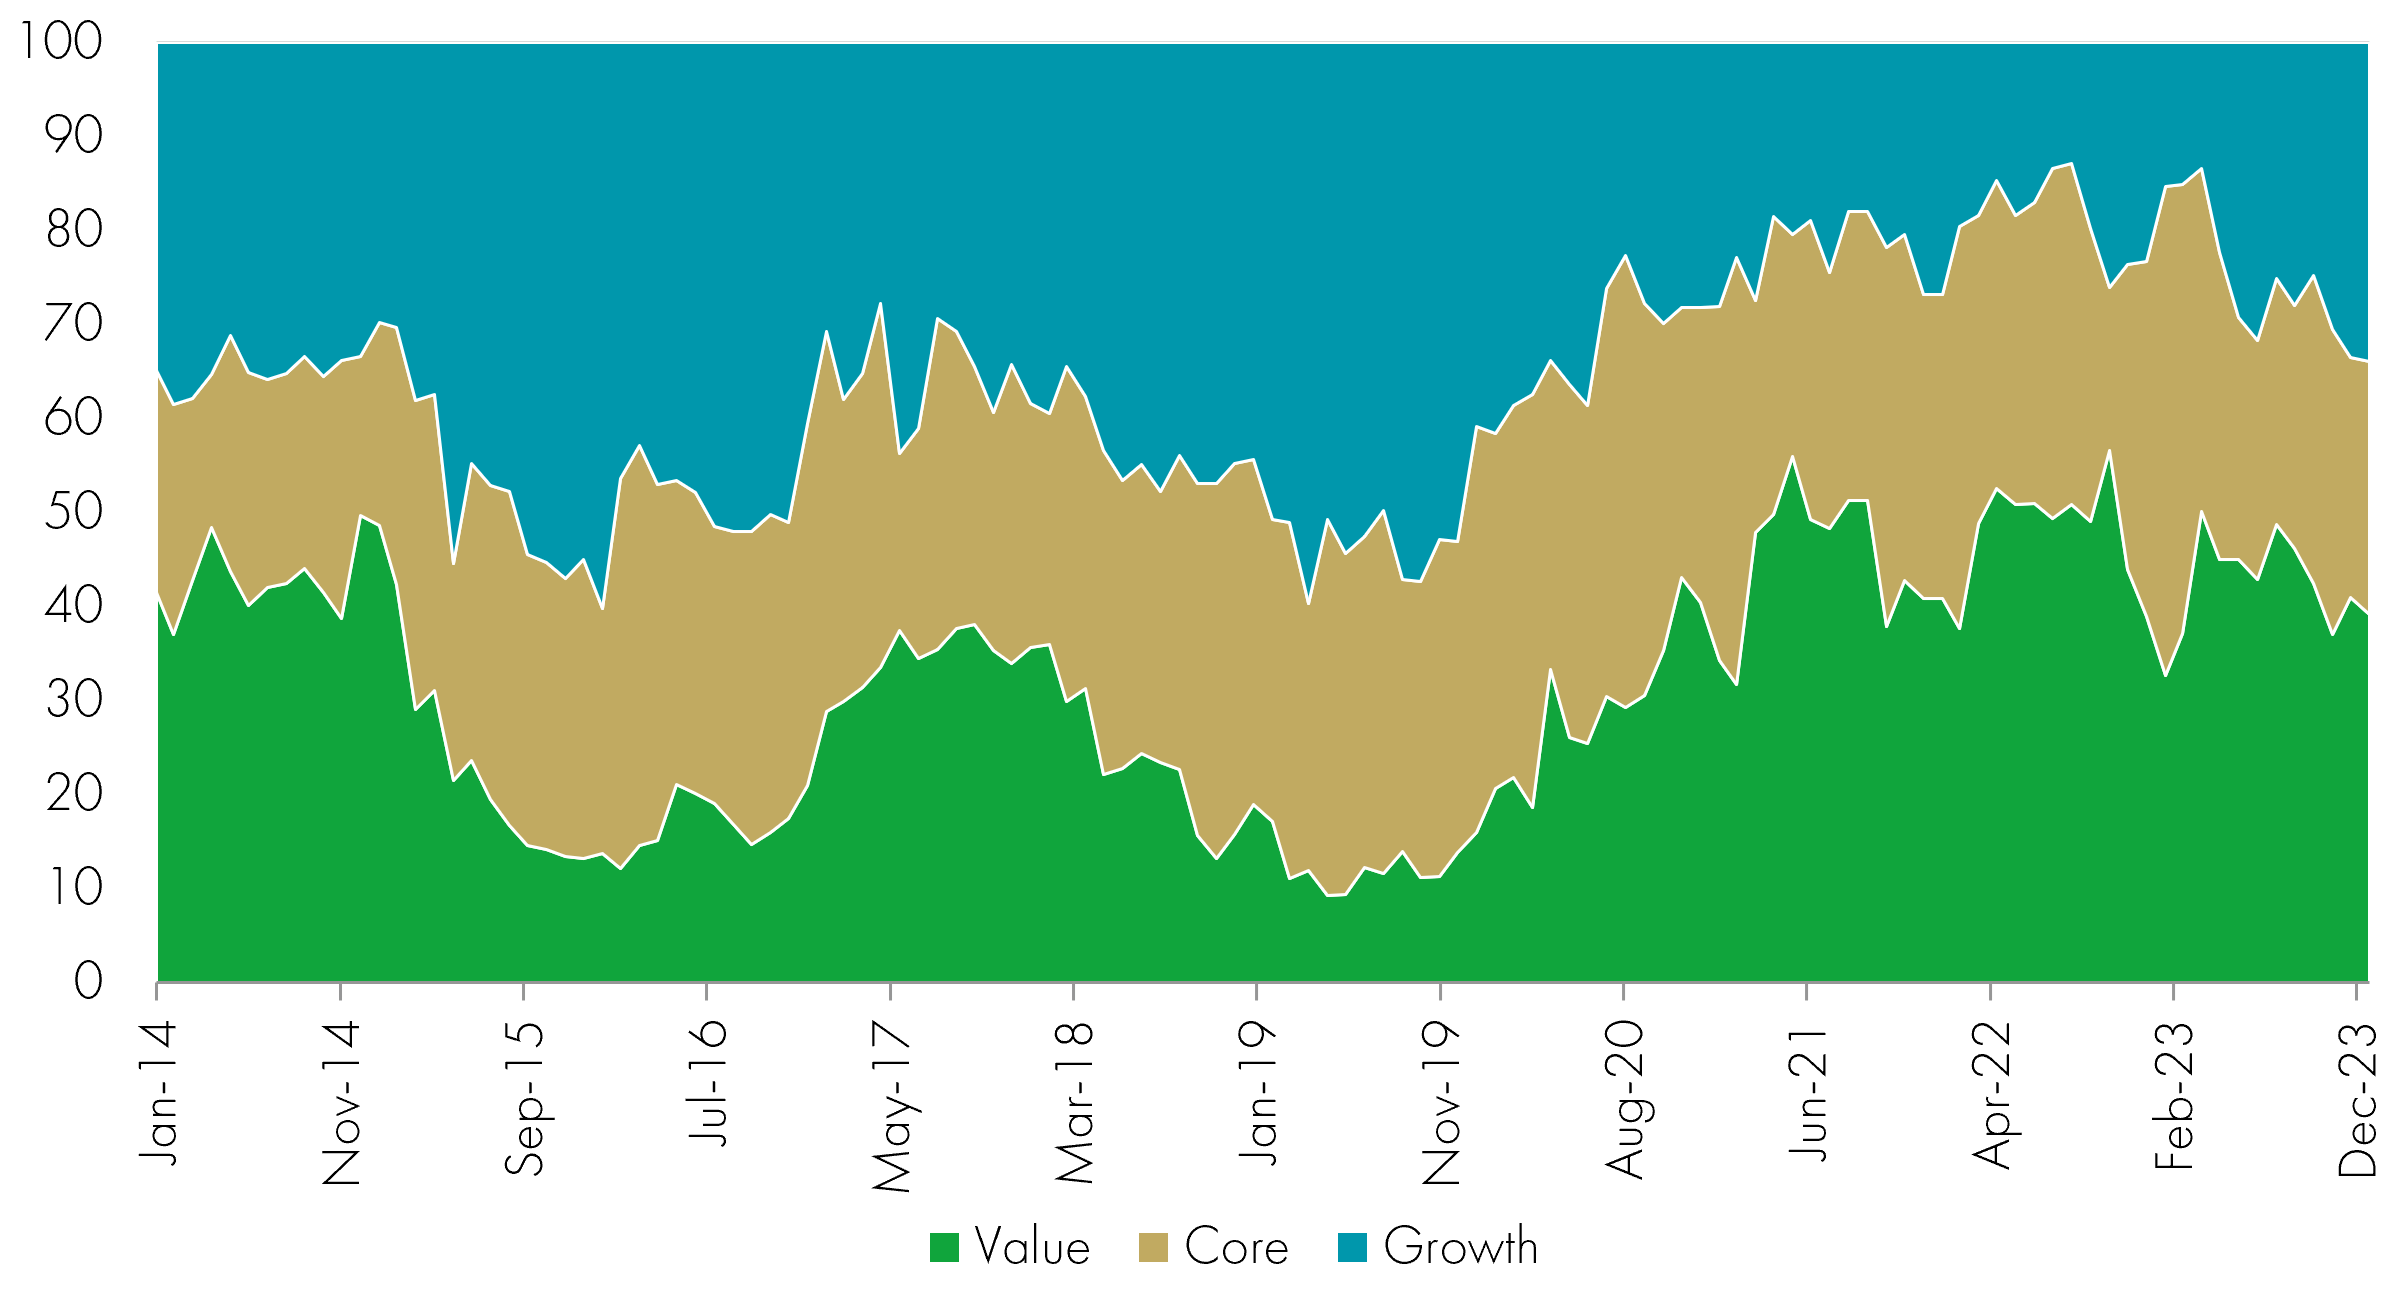
last 10 years doesn’t give much of an insight into the extent to which we have varied the style exposure over time to reflect the signals from our Market Regime Indicators. To focus on this aspect, we have instead plotted how the portfolio’s composition has shifted over time between these three styles:
Liontrust European Dynamic Fund: performance during different market conditions

Source: Morningstar, as at 31.12.23. Past performance does not predict future returns.
The analysis illustrated in the chart above shows that the portfolio tilt towards value, core and growth has changed significantly over the course of the last 10 years. For the first five years or so, cash generative companies with growth characteristics had been a mainstay in the portfolio, with exposure of around 50%. But as stockmarkets tumbled at the start of 2020 precipitated by the threat of Covid-19, all our market regime indicators were signalling the need to re-shape our portfolios with a heavy emphasis on our Contrarian Value secondary score. This shift was captured by the Morningstar categories as a pronounced increase in Value as the market impact of Covid unfolded – shown by the green segment rising from around 10% in mid 2019 to around 50% at points during 2022.
For a drilldown into the reasons underpinning this shift in portfolio emphasis and the manner in which the portfolio evolved as the global economy reacted to, and recovered from, the Covid crisis, read our Anatomy of a value rally blog written in mid-2022.
More style flexibility = better investment returns?
The next logical question to ask is: has the greater style flexibility from the introduction of secondary scores actually led to better investment returns?
Looking at some crude performance data, the initial signs are promising: in the ten years to 31 December 2023, the European Dynamic Fund has returned 206%, almost double the 106% return from the MSCI Europe Index benchmark. This performance places it solidly within the top decile of the Investment Association Europe ex-UK sector. But this excellent performance could be due to any number of factors. How can we be confident that the secondary scores introduction has contributed positively?
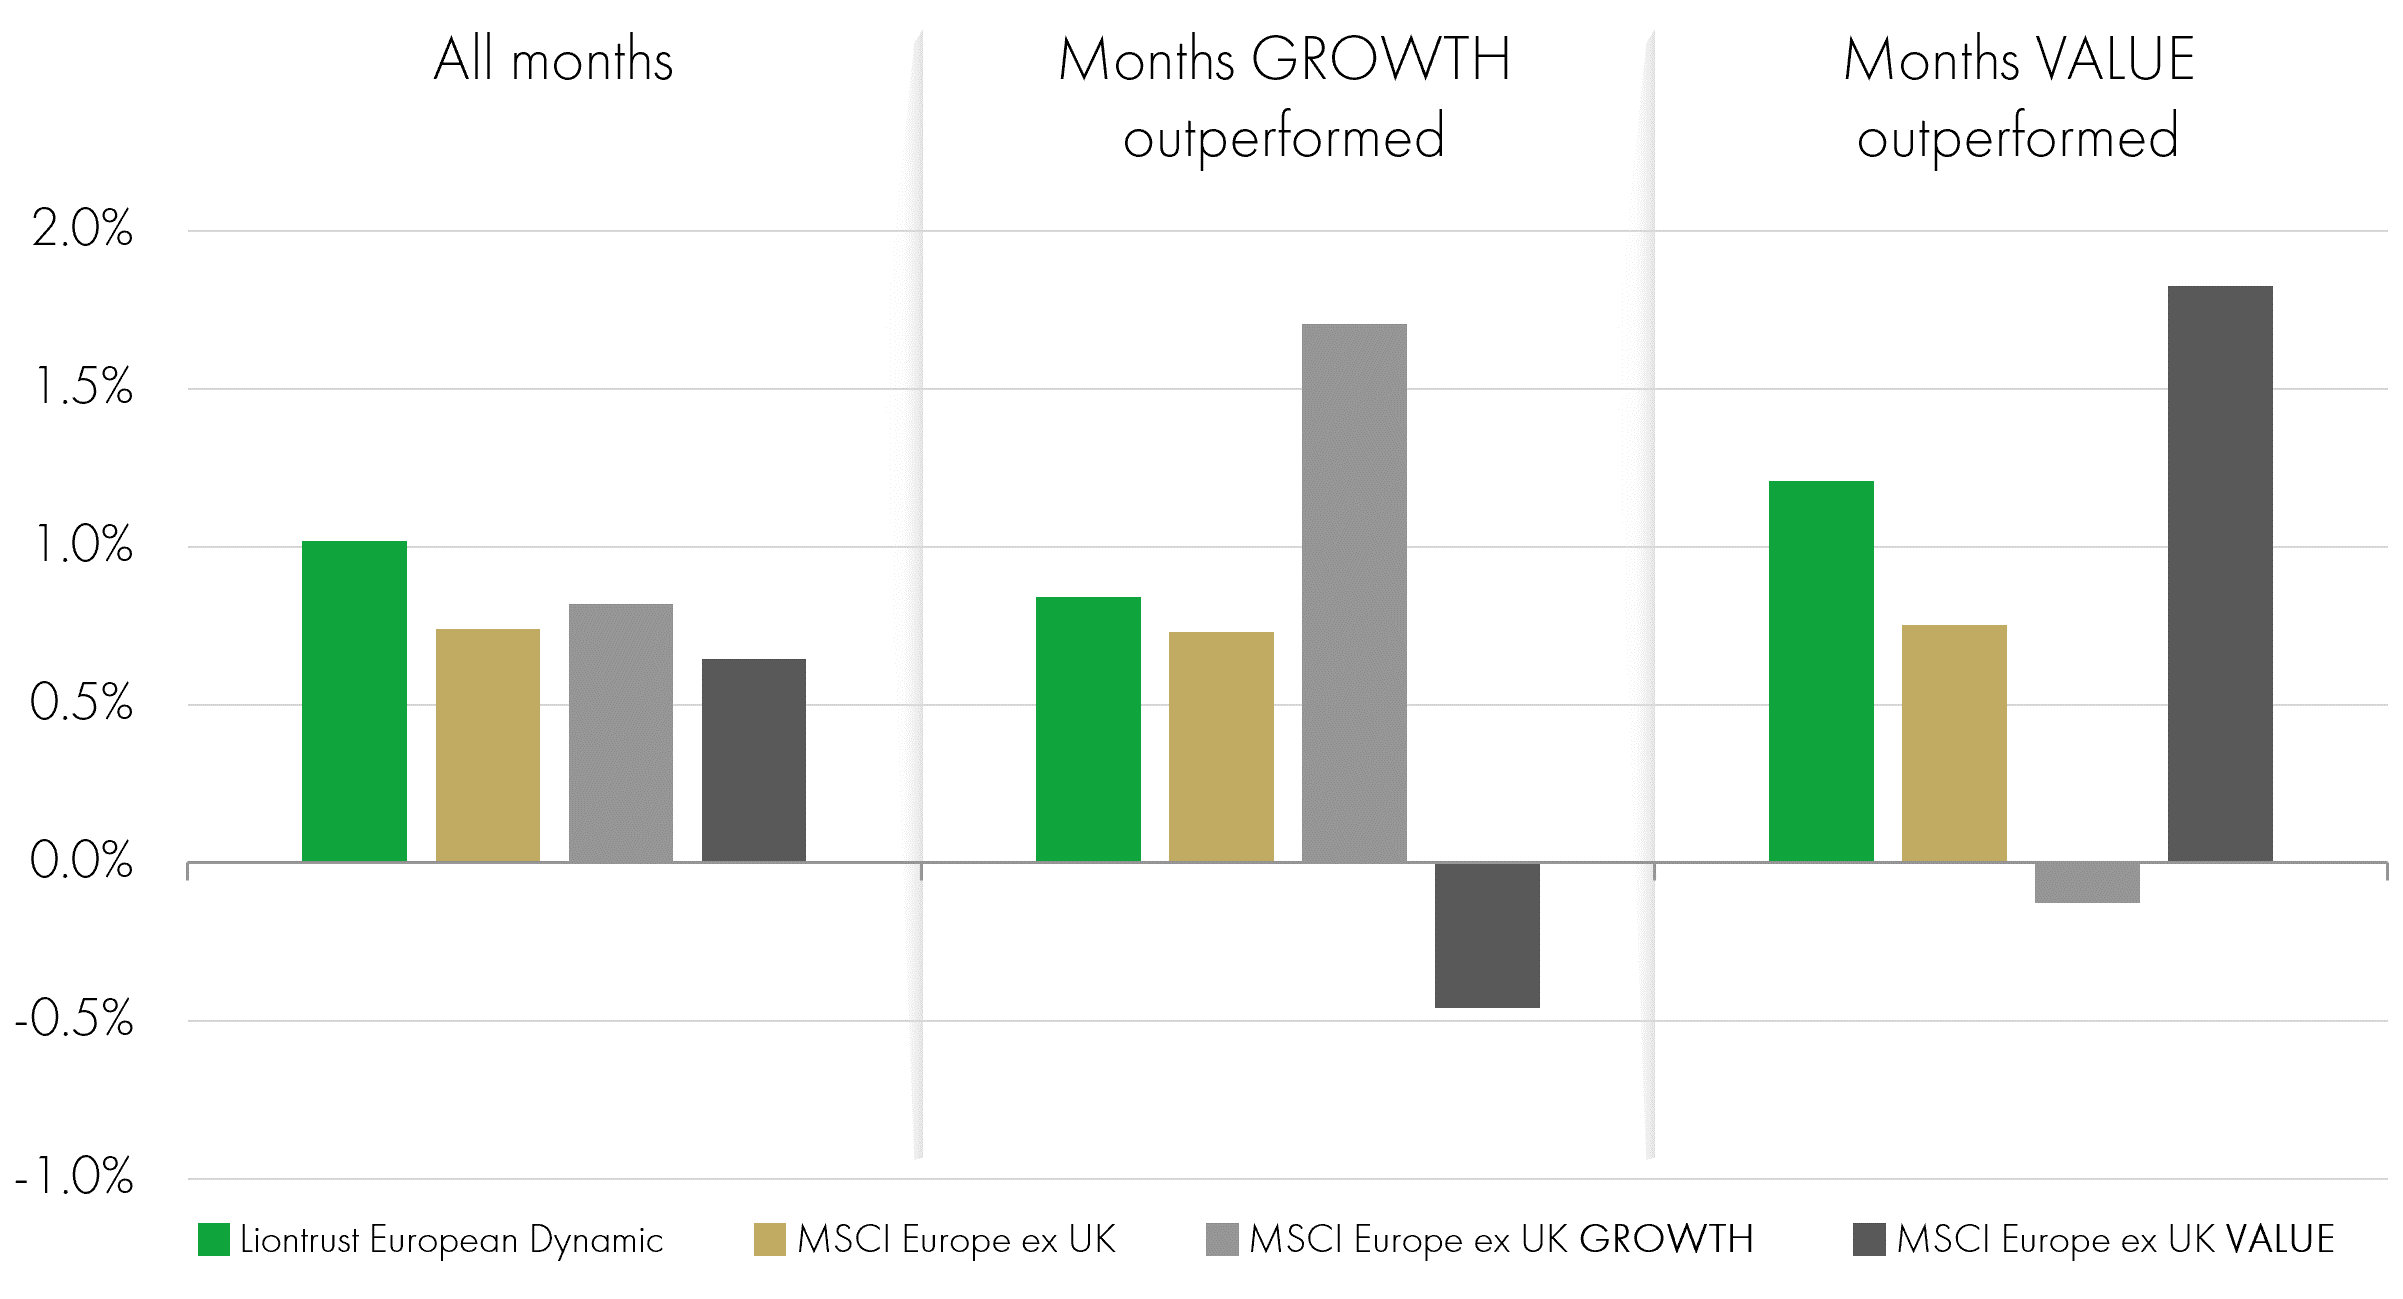
To help answer this question, we’ve analysed monthly returns since the start of 2014 to see how the Fund has performed in different style environments. As follows from the strong ten-year performance, the Fund’s average monthly return exceeds that of the MSCI Europe ex-UK Index – as shown in the left-hand third of the chart: “all months”. If we instead split out the 120 months into those where the MSCI Europe ex-UK Growth Index outperformed the broader market and those where the MSCI Europe ex-UK Value Index was on top, we see that in both sub-sets the Fund also outperformed the market.
Liontrust European Dynamic Fund: historical style exposure (time series)

This means that the Fund outperformed in market environments where growth styles were in the ascendancy as well as those where investors were rotating towards value.
Performance attribution is not an exact science due the number of different parameters and conclusions that can be applied to the same dataset. But this performance profile certainly provides good support for the idea that the secondary scores and market regime indicators are allowing us to successfully re-position the portfolio to best reflect the market backdrop.
Ongoing process improvements
We have been very pleased with how the secondary scores have enhanced the Cashflow Solution process, but this is just one element of a rigorous, in-depth investment process that we continue to improve year on year.
While 2024 will see us pass a rewarding milestone in the form of tenth anniversary of our secondary scores, our investment focus remains resolutely forward-looking – seeking to bring the accrued analytical power of our investment process to bear on portfolios as we position them for the current market environment. We are not complacent; we recognise that for good returns to persist we need constantly to be on the look out for ways in which we can improve our cash flow process. In 2024, as in previous years, this work will continue unabated.
KEY RISKS
Past performance is not a guide to future performance. The value of an investment and the income generated from it can fall as well as rise and is not guaranteed. You may get back less than you originally invested.
The issue of units/shares in Liontrust Funds may be subject to an initial charge, which will have an impact on the realisable value of the investment, particularly in the short term. Investments should always be considered as long term.
The Funds managed by the Cashflow Solution Team:
May hold overseas investments that may carry a higher currency risk. They are valued by reference to their local currency which may move up or down when compared to the currency of a Fund. May have a concentrated portfolio, i.e. hold a limited number of investments. If one of these investments falls in value this can have a greater impact on a Fund's value than if it held a larger number of investments. May, under certain circumstances, invest in derivatives, but it is not intended that their use will materially affect volatility. Derivatives are used to protect against currencies, credit and interest rate moves or for investment purposes. There is a risk that losses could be made on derivative positions or that the counterparties could fail to complete on transactions. The use of derivatives may create leverage or gearing resulting in potentially greater volatility or fluctuations in the net asset value of the Fund. A relatively small movement in the value of a derivative's underlying investment may have a larger impact, positive or negative, on the value of a fund than if the underlying investment was held instead. The use of derivative contracts may help us to control Fund volatility in both up and down markets by hedging against the general market. The use of derivative instruments that may result in higher cash levels. Cash may be deposited with several credit counterparties (e.g. international banks) or in short-dated bonds. A credit risk arises should one or more of these counterparties be unable to return the deposited cash. May encounter liquidity constraints from time to time. The spread between the price you buy and sell shares will reflect the less liquid nature of the underlying holdings. Outside of normal conditions, may hold higher levels of cash which may be deposited with several credit counterparties (e.g. International banks). A credit risk arises should one or more of these counterparties be unable to return the deposited cash. May be exposed to Counterparty Risk: any derivative contract, including FX hedging, may be at risk if the counterparty fails. May target an absolute return. There is no guarantee that an absolute return will be generated over the time period stated in the fund objective or any other time period.
The risks detailed above are reflective of the full range of Funds managed by the Cashflow Solution Team and not all of the risks listed are applicable to each individual Fund. For the risks associated with an individual Fund, please refer to its Key Investor Information Document (KIID)/PRIIP KID.
DISCLAIMER
This is a marketing communication. Before making an investment, you should read the relevant Prospectus and the Key Investor Information Document (KIID), which provide full product details including investment charges and risks. These documents can be obtained, free of charge, from www.liontrust.co.uk or direct from Liontrust. Always research your own investments. If you are not a professional investor please consult a regulated financial adviser regarding the suitability of such an investment for you and your personal circumstances.
This should not be construed as advice for investment in any product or security mentioned, an offer to buy or sell units/shares of Funds mentioned, or a solicitation to purchase securities in any company or investment product. Examples of stocks are provided for general information only to demonstrate our investment philosophy. The investment being promoted is for units in a fund, not directly in the underlying assets. It contains information and analysis that is believed to be accurate at the time of publication, but is subject to change without notice.


